Figure 3.
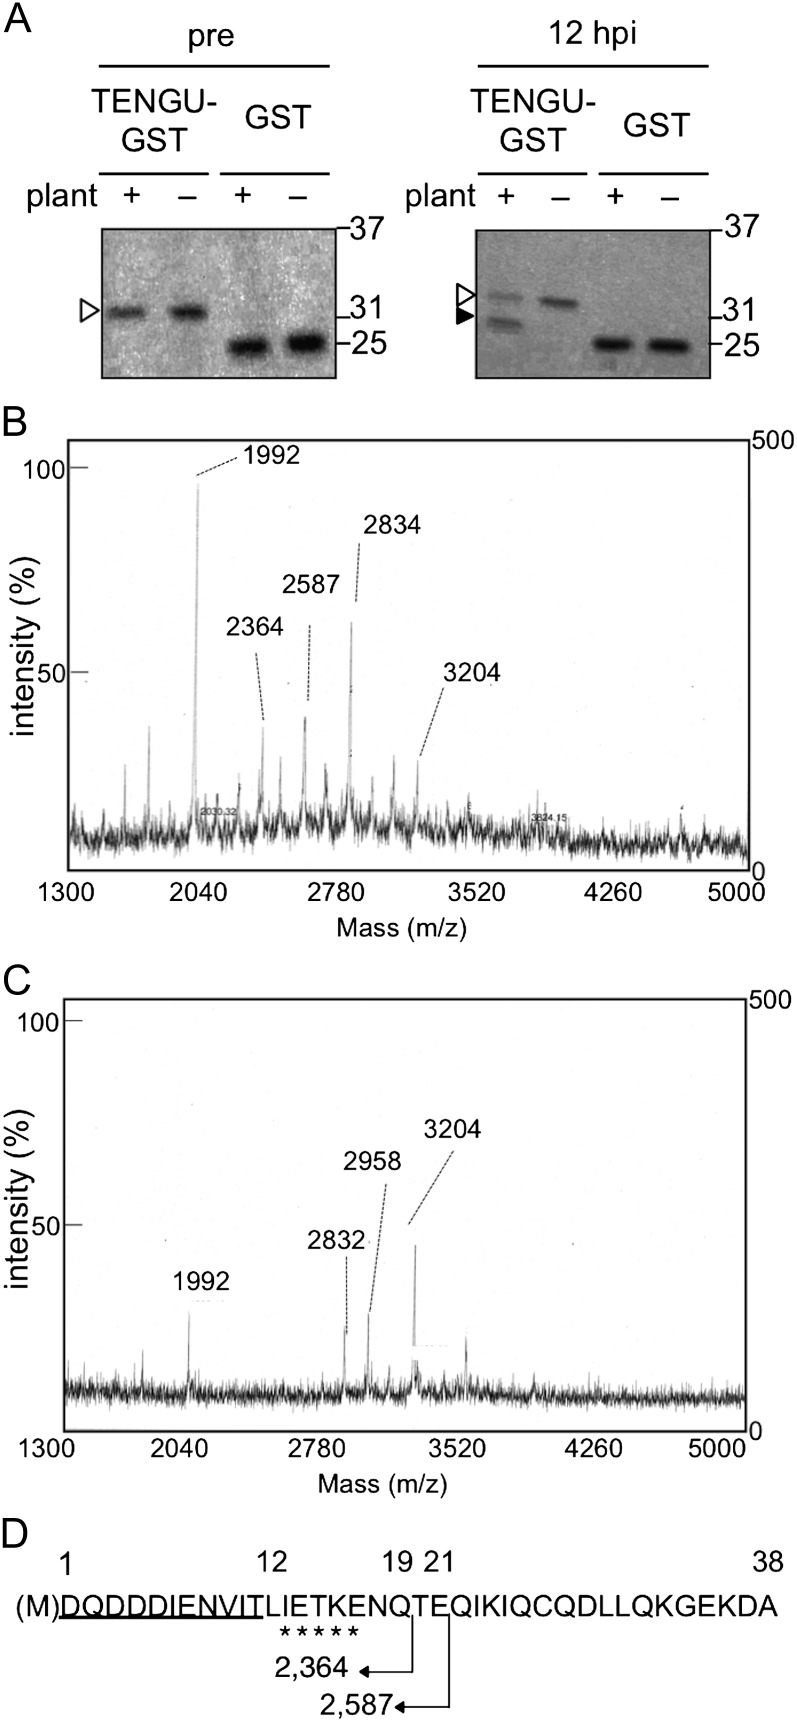
In vitro processing of the recombinant TENGU-GST protein. A, TENGU-GST and GST protein were incubated with or without plant extract. Both proteins were analyzed by gel electrophoresis followed by Coomassie Brilliant Blue staining before (pre; left panel) and after 12 h of incubation (12 h post incubation [hpi]; right panel). White arrowheads indicate bands corresponding to full-length TENGU-GST, and the black arrowhead indicates that the band corresponds to the processing product. Molecular size markers (kD) are shown on the right. B, TOF-MS spectrum of TENGU-GST incubated with plant extract. C, TOF-MS spectrum of TENGU-GST incubated with buffer. m/z, Mass-to-charge ratio. D, Schematic representation of TENGU processing. Sequence obtained by Edman sequencing is marked by asterisks. The TENGU functional region (11 residues) is underlined. The predicted molecular mass (D) of the partial fragments of TENGU is indicated below the sequence.

