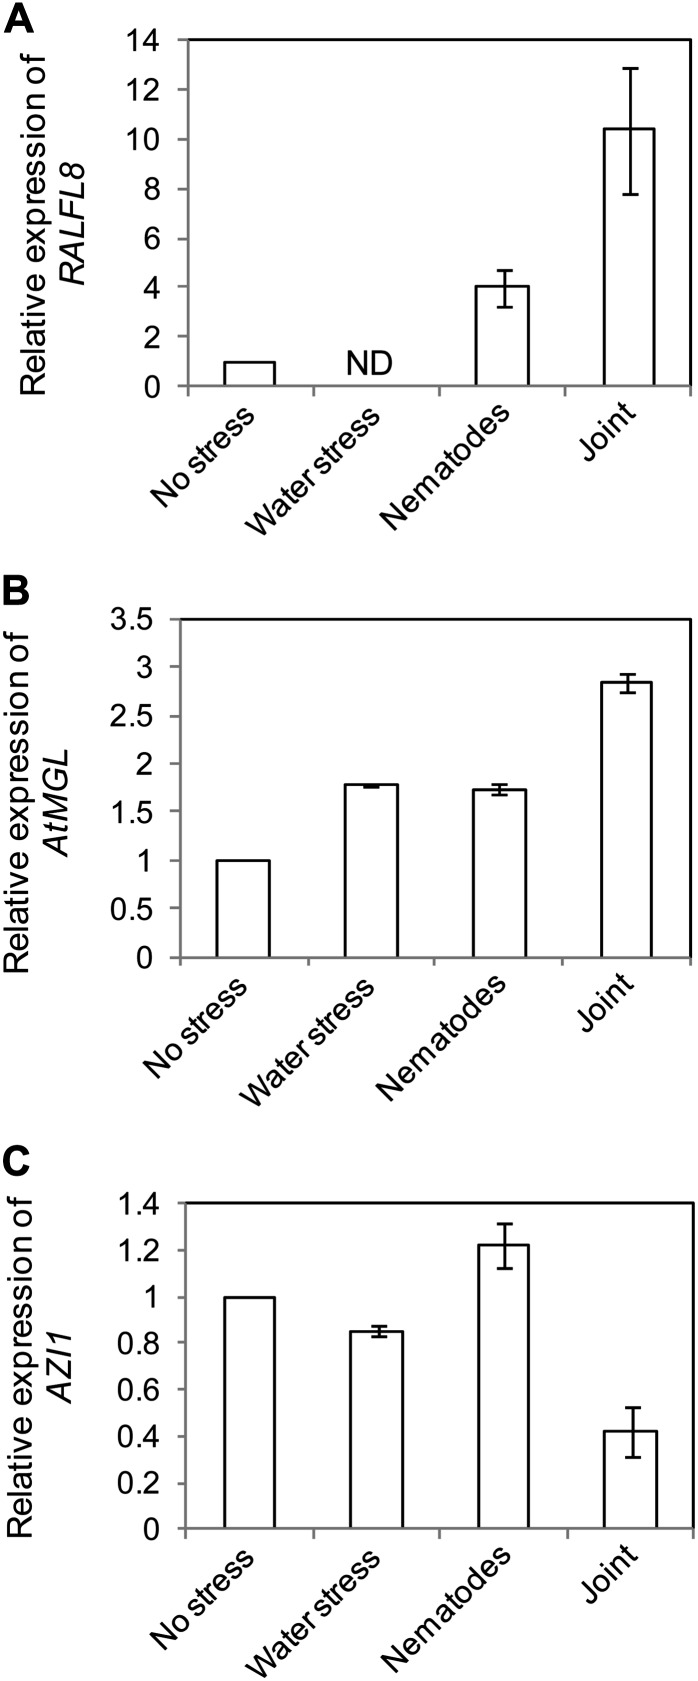
Figure 2.
Relative expression of candidate genes in leaves of plants under differing stress treatments. The expression levels of AtRALFL8 (A), AtMGL (B), and AZI1 (C) are shown relative to the unstressed samples, as analyzed by qRT-PCR. RNA was pooled from 40 plants. Error bars represent se of the means of three technical replicates. ND, Not detected.

