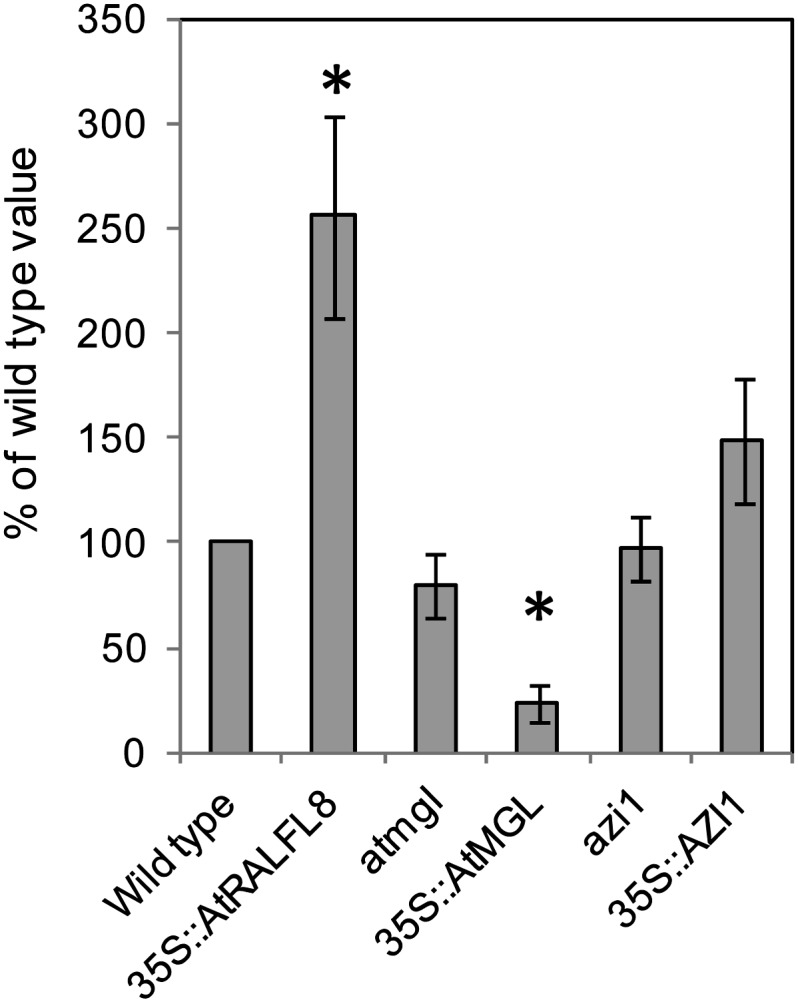
Figure 7.

Nematode susceptibility assays. Mutant and overexpression lines for each candidate gene were exposed to 100 J2 H. schachtii nematodes per plant. Nematodes were allowed to develop for 10 d, then roots were stained and the number of established third- and fourth-stage juvenile nematodes (J3 and J4) counted per plant. The mean number of nematodes per plant for each genotype is expressed as a percentage of the wild-type value (100%). Asterisks show a significant difference from the wild type (n = 10–12; *P < 0.05).
