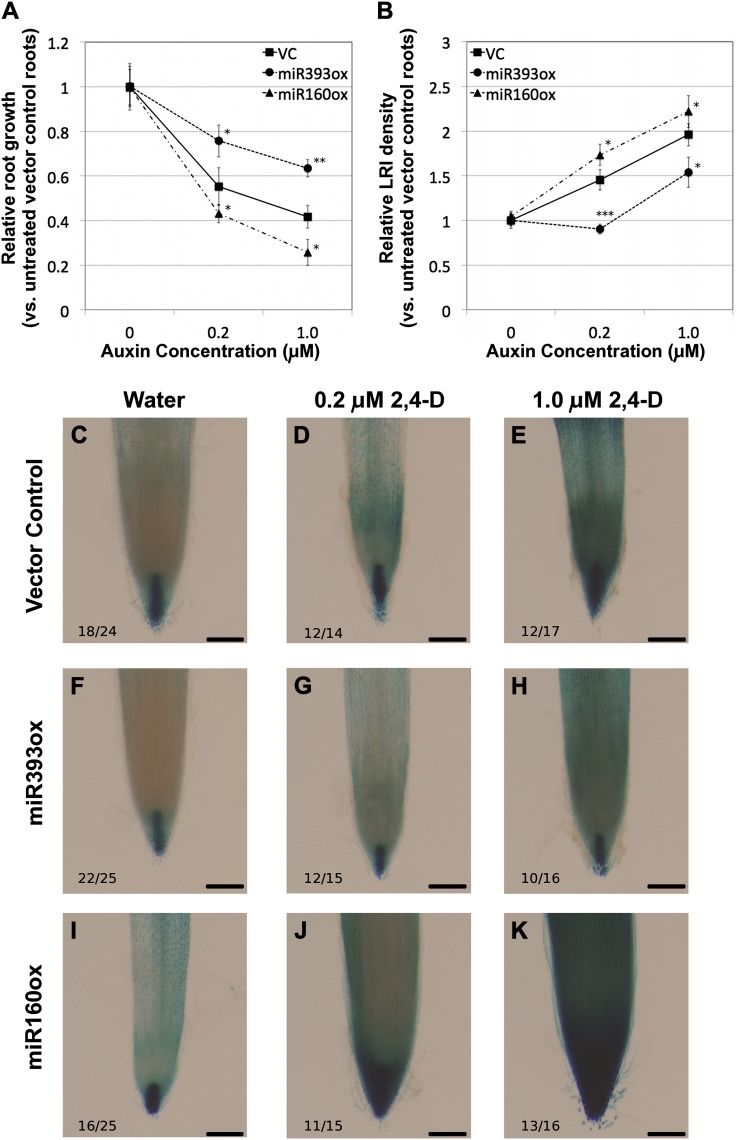
Figure 2.
Physiological and molecular responses of miR393- and miR160-overexpressing soybean composite plant roots to exogenous auxin. A and B, Relative root elongation (A) and lateral root density (B) in response to treatment with 0, 0.2, or 1.0 μm 2,4-D compared with untreated vector control (VC) roots. Data presented are averages ± se from at least 20 roots per data point. Asterisks indicate the level of statistically significant difference, if any, compared with vector control roots (*P < 0.05, **P < 0.01, ***P < 0.001). C to K, DR5:GUS expression in root tips of untreated (C, F, and I) and auxin-treated (D, G, and J, 0.2 μm; E, H, and K, 1.0 μm) vector control (C–E), miR393ox (F–H), and miR160ox (I–K) roots. The number of independent transgenic roots showing the representative staining pattern out of the number of roots examined is indicated in each panel. Bars = 200 μm.

