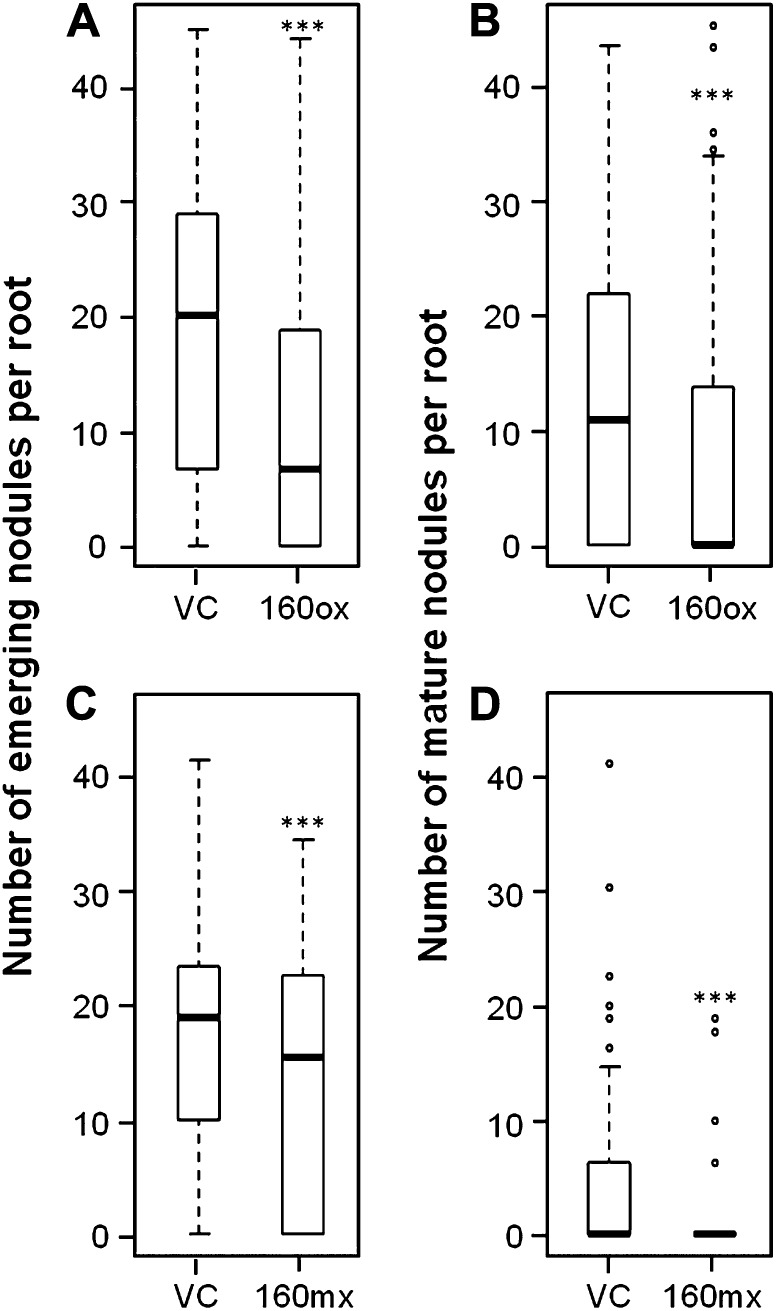
Figure 5.
Nodule development in roots overexpressing or misexpressing miR160. Box plots show the distribution of emerging (A and C) and mature (B and D) nodules per root in miR160ox (A and B) and miR160mx (C and D) roots compared with the respective vector control (VC) roots. Data shown are from at least 90 roots for each construct. Boxes indicate data within the first and third quartiles, and the thick black line indicates the median. Potential outliers, if any, are depicted as circles. Asterisks indicate the level of statistically significant difference, if any, compared with the respective vector control roots (*P < 0.05, **P < 0.01, ***P < 0.001).

