A simple and high-sensitivity quantitation strategy based on simplified extraction, purification, and derivatization processes enables quantification of brassinosteroids in small amounts of plant tissue.
Abstract
Quantification of brassinosteroids is essential and extremely important to study the molecular mechanisms of their physiological roles in plant growth and development. Herein, we present a simple, material and cost-saving high-performance method for determining endogenous brassinosteroids (BRs) in model plants. This new method enables simultaneous enrichment of a wide range of bioactive BRs such as brassinolide, castasterone, teasterone, and typhasterol with ion exchange solid-phase extraction and high-sensitivity quantitation of these BRs based on isotope dilution combined with internal standard approach. For routine analysis, the consumption of plant materials was reduced to one-twentieth of previously reported and the overall process could be completed within 1 day compared with previous 3 to 4 days. The strategy was validated by profiling BRs in different ecotypes and mutants of rice (Oryza sativa) and Arabidopsis (Arabidopsis thaliana), and the BR distributions in different model plants tissues were determined with the new method. The method allows plant physiologists to monitor the dynamics and distributions of BRs with 1 gram fresh weight of model plant tissues, which will speed up the process for the molecular mechanism research of BRs with these model plants in future work.
Brassinosteroids (BRs) have been considered as the sixth class of endogenous plant hormones with wide occurrence across the plant kingdom (Bajguz and Tretyn, 2003). BRs play a key role in a variety of physiological processes, such as cell elongation, vascular differentiation, reproductive development, photomorphogenesis, stress tolerance, and so on (Hayat, 2010). Recently, it was found that BR deficiency could increase grain yield in rice (Oryza sativa) by more than 30%, which showed a food security-enhancing potential and guided new green revolution in the future (Sakamoto et al., 2006; Wu et al., 2008). Since BRs were first isolated and identified from rape (Brassica napus) pollen in 1970s (Mitchell et al., 1970; Grove et al., 1979), the natural occurrence of more than 60 BRs in a large quantity of plant species has been reported (Hayat, 2010). To date, research on the occurrence of BRs in different plants, physiological properties, and their action modes has made much progress (Fujioka and Yokota, 2003; Symons et al., 2008; Kim and Wang, 2010; Tang et al., 2010; Tong and Chu, 2012). However, so far, only limited information was obtained to understand the molecular mechanism of the physiological role of BRs. For example, although the biosynthetic pathway of C28 BRs has been well established, the biosynthesis of C27 and C29 BRs remains unclear, and some intermediates on their biosynthetic pathways still need to be elucidated (Noguchi et al., 2000; Fujita et al., 2006). The plant physiology research of BRs is speeded up by employing BR mutants on biosynthesis and signaling pathways (Yamamuro et al., 2000; Hong et al., 2003; Kwon and Choe, 2005; Tanabe et al., 2005); however, a simple, high-sensitivity screening, detection, and quantification method for BR analysis is still a bottleneck technique for in-depth studying of the role of BRs during the life cycle of plants.
In the past 20 years, most of the detection and identification processes of BRs could be described briefly as the following steps. The harvested plant materials were lyophilized and then ground to a fine powder, followed by the CH3OH/CHCl3 extraction. The concentrate was then partitioned with the CHCl3/H2O system three times. After that, the CHCl3 fraction was subjected to a silica gel column for BR enrichment, and the collected BRs-containing fraction was purified with Sephadex LH-20 column and Sep-Pak Plus C18 cartridge in sequence. At last, the collected fractions were purified with preparative HPLC and then derivatized for analysis with gas chromatography-mass spectrometry (MS) under selected ion monitoring mode (Hong et al., 2005; Nomura et al., 2005; Kim et al., 2006). So far, this protocol has been proven to be workable in most cases and provided a great quantity of valuable data for plant physiological research (Hwang et al., 2006; Lee et al., 2010). However, at least more than 20 g of plant materials were consumed for quantifying/identifying BRs in one plant sample without replicates (Hong et al., 2005; Bancos et al., 2006; Kim et al., 2006), and it is difficult to collect sufficient plant tissues for BR measurement in some rare model plant mutants. In addition, the method involved multiple tedious and labor-intensive steps, which might result in poor recovery and low sensitivity, especially for some labile BR intermediates. The traditional method took one person about 3 to 4 d to treat one batch of samples. Most of the BR measurement experiments were performed without biological replicates using traditional methods due to the disadvantages mentioned above, which discounted the reliability of the results. Therefore, a simple, rapid, and sensitive analysis method for BRs is in urgent need, along with the development of BR research.
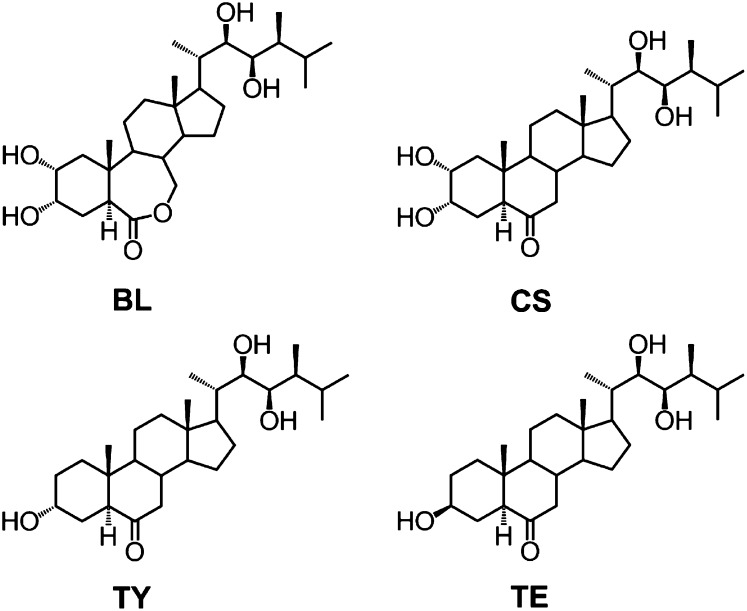
Recently, several efforts were made to improve the BR determination (Svatos et al., 2004; Huo et al., 2012). The consumption of plant material was reduced to 2 g after modifying the BRs with a new derivatization reagent for further ultra-performance liquid chromatography (UPLC)-multiple reaction monitoring (MRM)-MS detection. However, the purification process consisting of deproteinization and multiple solid-phase extraction (SPE) steps was still quite tedious and couldn’t guarantee covering the four most important bioactive BRs, including brassinolide (BL), castasterone (CS), teasterone (TE), and typhasterol (TY; Fig. 1). In our previous study (Xin et al., 2013), we reported a simple, convenient, and high-sensitivity method for detection of endogenous BRs from real plant materials based on the dual role of specific boronate affinity. Although it was the first time to measure multiple BRs in subgram plant materials and the time duration of the method decreased to one-third of that previously reported, the synthesis of boronate affinity-functionalized magnetic nanoparticles made the method difficult to follow in biological laboratories for routine analysis.
Figure 1.
Chemical structure of four major bioactive BRs.
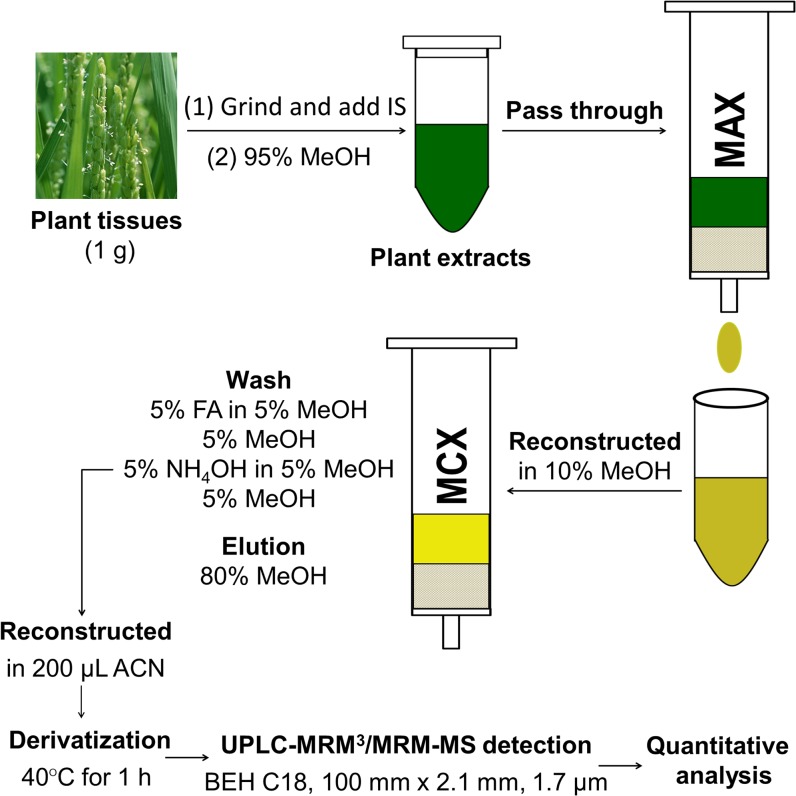
BRs are neutral steroid compounds with a common four-ring cholestane skeleton and hydroxyl groups on A ring and/or the side chain linked to D ring. Especially, the vicinal diol moieties on C22 and C23 sites of BL, CS, TY, and TE allow these bioactive BRs to be derivatized with ionizable reagents for MS response enhancement. Considering the unique physicochemical properties of BRs, we herein developed a simplified high-sensitivity analytical method based on mixed-mode anion exchange (MAX)-cation exchange (MCX) solid phase extraction (SPE) purification, vicinal diol derivatization combined with UPLC-MRM3-MS detection for quantification of BL, CS, TE, and TY in model plants (Fig. 2). The performance of the method was demonstrated by determination of BRs in different tissues of both wild-type and mutant Arabidopsis (Arabidopsis thaliana) and rice.
Figure 2.
Simplified high-sensitivity protocol for quantitative analysis of BRs. IS, Internal standards. [See online article for color version of this figure.]
RESULTS AND DISCUSSION
Optimization of Derivatization Reagent and Conditions to Enhance the MS Responses of BRs
BR compounds are hydrophobic neutral terpenoid-type molecules with several hydroxyl groups as the only polar moieties, which makes them difficult to ionize in electrospray ionization (ESI)-MS due to their low proton affinity. The physicochemical properties of BRs lead to poor sensitivity when analyzed with liquid chromatography-ESI-MS. Generally speaking, an atmospheric pressure chemical ionization source might seem more suitable for BRs detection. However, the limit of detection of 24-epibrassinolide (24-epiBL, the 24-epi isomer of BL) with atmospheric pressure chemical ionization was investigated to be 4.4 picogram (pg), 10 times higher than the ESI source (Supplemental Fig. S1), so derivatization combined with ESI-MS detection is a good option.
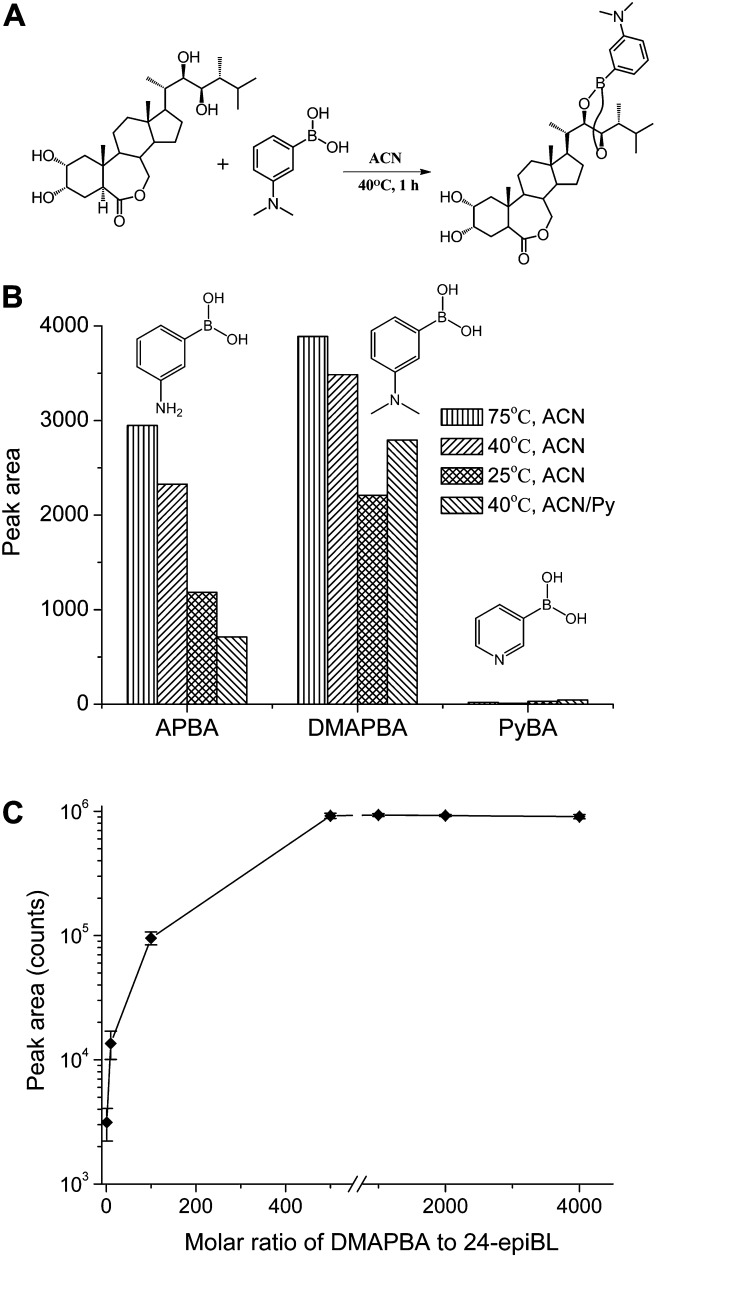
Considering the common occurrence of vicinal diol functional groups on the side chain of most BRs such as BL, CS, TY, and TE, three nitrogen-containing organic boronic acid candidates, 3-aminophenylboronic acid (APBA), 3-(dimethylamino)-phenylboronic acid (DMAPBA), and 3-pyridylboronic acid (PyBA; Fig. 3, A and B), were selected to derivatize these four BRs. The boronic acid moiety could covalently react with the vicinal diol functional group of BRs specifically under mild condition. The nitrogen-containing functional group of the derivates give the BR compounds enhanced ionization efficiency when analyzed with ESI-MS. Then, 24-epiBL, one of the most highly oxidized and bioactive BR compounds, was selected as a model molecule to screen the derivatization reagents and optimize the derivatization reaction condition. To obtain the best derivatization efficiency, all the reactions were performed under anhydrous condition using acetonitrile as solvent. The MS responses (peak area) of the derivatization products were used to monitor the reaction yield and sensitivity enhancement. Figure 3B shows the effects of temperature and catalyst (pyridine) on the derivatizing reaction. As is seen from Figure 3B, the MS response of derivatized 24-epiBL dominated other derivatized types and reaction conditions when reacting with DMAPBA at 75°C, so DMAPBA was selected in our new method. Finally, the derivatization procedure of real plant samples was performed in anhydrous acetonitrile (ACN) at 40°C for 1 h, considering the labile lactone structure of some BRs under high temperature. The limit of detection was examined to be 15.8 femtogram (fg) for DMAPBA-derivatized 24-epiBL, which means 25-fold increase in sensitivity compared with the underivatized one (Supplemental Fig. S1). The optimized derivatization condition is much more mild than the literature method (Svatos et al., 2004), which guaranteed a more practicable approach to detection of BRs from real plant tissues.
Figure 3.
Optimization of derivatization reagents and the reaction conditions. A, Representative reaction formula of 24-epiBL with DMAPBA. B, Chemical formulae of derivatization reagent candidates and their derivatization efficiency under different reaction conditions. Py, Pyridine. The time durations for all derivatization conditions were 1 h. The efficiency was measured on UPLC-ESI-QTOF MS in positive MS mode. The target m/z was extracted with the window of 0.02 Da, and the peak area was acquired to monitor the product yields. C, The effect of molar ratio of DMAPBA to 24-epiBL on the derivatization product yields. The reactions were performed in ACN at 40°C for 1 h. Error bars represent the sd (n = 3).
Furthermore, to ensure that all BRs were derivatized by DMAPBA, the correlation analysis for molar ratio of DMAPBA to 24-epiBL and the derivatization product yield was studied systematically. From Figure 3C, it can be seen that the product amount went to plateau when the ratio was above 500. Therefore, for derivatization of 1 g real plant samples, the dosage of DMAPBA was set as 30 μg to ensure a molar ratio of 2000 (1 ng BR g–1 fresh weight [FW] plant tissues). In addition, more DMAPBA (60 and 90 μg) cannot increase BRs-DMAPBA product yield effectively in real samples (Supplemental Table S1), which indicated 30 μg was enough to derivatize all BRs to give accurate and reliable quantitative results.
Improved Extraction and Purification Protocol for BRs Based on MAX-MCX Strategy
Although the MS responses of BRs can be improved through derivatization, it is still not sufficient to detect BRs in real plant materials because of complicated matrix effect. The matrix suppression is still present even after routine SPE purification process and UPLC separation, so an efficient purification protocol for BR compounds should be developed to remove naturally occurring interferences in the crude plant extracts as far as possible. Usually, a high-performance purification procedure consists of multiple handling steps, which will result in lower recovery of target molecules, so it is crucial to keep a balance between interference elimination and recovery of BRs in real plant samples. As mentioned above, BRs are neutral steroid-type compounds with lower proton affinity, which leads to poor sensitivity when detected with ESI source MS. In addition, the occurrence of complicated ionizable metabolites in plant extracts will further suppress the ionization of BRs in the ESI source of MS and exacerbate the detection sensitivity of BRs. Therefore, the new purification strategy should consider decreasing or getting rid of all ionizable metabolites and eliminating the negative effects of these interferences.
First, 95% (v/v) aqueous methanol was used to extract BRs from fresh plant materials, instead of the commonly used extracting solvent of MeOH-CHCl3 (4:1) as described in the literature (Bishop et al., 2005; Matsuoka et al., 2005; Kim et al., 2006). It was found that the solubility of ergosterol, a steroid with similar structure and comparative hydrophobicity to BR biosynthetic precursors, can reach several tens of micrograms per milliliter of 95% (v/v) methanol aqueous solution in our previous experiment. Considering the reported endogenous BR contents in the literature, 95% (v/v) methanol is strong enough to extract most BRs from plant tissues.
Subsequently, the crude extracts were subjected to a two-step SPE procedure using MAX and MCX cartridges, which are mixed-mode anion and cation exchange sorbents featuring ion exchange and reversed-phase mechanisms. The crude extracts were first allowed to flow through the MAX cartridge, and BRs would pass through along with 95% (v/v) methanol solvent due to their nonionic property and weak reversed-phase interaction in 95% (v/v) methanol, while all the acidic interferences were strongly retained on the MAX column based on the anion ion exchange mechanism. The recovery of BRs was measured to be above 95% using the 24-epiBL standard as probe. After removal of acidic interferences, the collected pass-through fraction was reconstructed in 10% (v/v) methanol aqueous solution and loaded onto the activated MCX cartridge. Compared with the MAX procedure, BRs were retained and enriched on the cartridge via reversed-phase interaction mechanism in 10% (v/v) methanol. After a sequential washing with 5% (v/v) formic acid (FA) in 5% (v/v) methanol, 5% (v/v) methanol, 5% (v/v) NH4OH in 5% (v/v) methanol, and 5% (v/v) methanol to wash out the hydrophilic and basic interferences (the dual 5% (v/v) methanol steps were transitions of great pH change to avoid unpredictable damages to MCX cartridges and could be deleted depending on the specific circumstance), BRs were eluted with 80% (v/v) methanol and collected, while more hydrophobic and strong basic interferences were still retained on MCX sorbents. The recovery of the MCX procedure was determined to be about 80% for the 24-epiBL standard. At last, the BR-containing fraction was subjected to derivatization as described above for further MS detection. Considering that TE and TY would be quantified using D3-CS as internal standard, the recoveries of TE, TY, and CS through the purification and derivatization process were determined to be 81.3 ± 16.0%, 73.5 ± 12.5%, and 68.5 ± 17.3% (n = 3), respectively. The recovery difference between TE, TY, and CS would be used to derive a recovery calibration factor to make the quantification of TE and TY more accurate, which will be discussed below in the quantitation section.
To summarize, most of the acidic and basic ionizable interferences were eliminated by the improved purification protocol based on MAX-MCX SPE strategy. The total recovery of the whole process was about 75%, which ensured the quantification of BRs from a small amount of real plant tissues. In the following quantitation experiment, the most common four major BRs (BL, CS, TY, and TE) were measured in 1 g wild-type plant samples, only about one-twentieth to one-tenth of that used in the traditional method. The plant materials might be reduced to hundreds of milligrams for some BR intensive mutants such as bri1 (mutated in the BR receptor), which means the new method is more practicable for BR research with model plants. In addition, the new developed protocol is simple, high throughput, and time saving, by which one can easily complete the experiment of more than 10 plant samples, each with three replicates, within 12 h, far less than the widely reported procedure. It is a simple, low cost, and high performance protocol for BR purification.
Multiple Candidate BR Enrichment with MAX-MCX Strategy in Rice Panicles Verified by MS
For in-depth studying BR biosynthesis, metabolism, and signaling pathways, it is important to develop an efficient isolation and detection method to cover a broad spectrum of the most bioactive BRs, including known ones and even unknowns, from mutants or transgenetic lines for new biosynthesis or metabolic pathway validation.
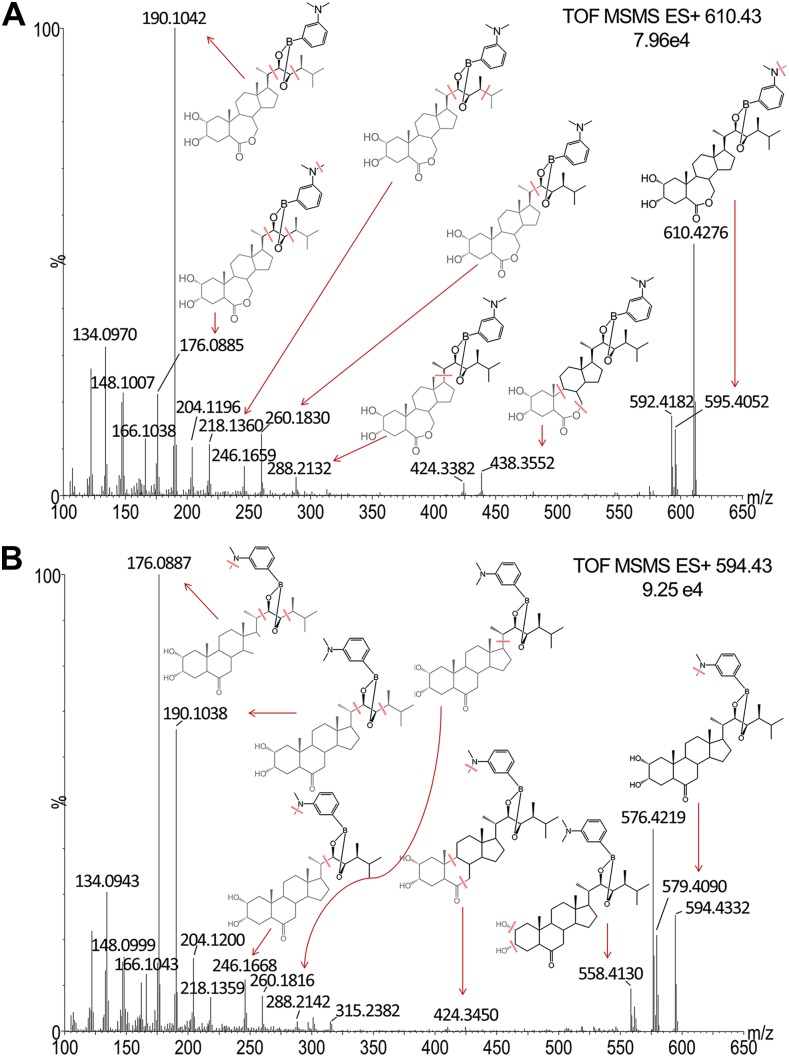
To check the practicability of the new strategy for multiple BR profiling, tandem-MS (MS/MS) spectra of BL-DMAPBA and CS-DMAPBA were studied for identification of potential BR-DMAPBA components. As is shown in Figure 4, most of the fragment ions were assigned. In the high mass region, the fragment ions are derived from the neutral loss of ⋅CH3 and H2O. The fragment ions from mass-to-charge ratio (m/z) 166.1 to 450 cover dissociation cites on the four-ring skeleton of BRs, which can be attributed to the common structural region of BR-DMAPBA. The m/z 166.10 is from the fragment of DMAPBA (m/z = 166.1039). The daughter ions from m/z 176.1 to 288.1 are from DMAPBA residue linked with different -CH2 units, suggesting the structure of the side fatty chain. In the characteristic fingerprint region of m/z 300 to 450, BL is different from CS in the fragment pattern. For BL, the relative intensities of fragment ions m/z 424.3 and 438.3 resulting from dissociation of seven-member B ring are higher than the fragment ions m/z 301.2 and 315.2 from the cross-ring cleavage of D ring. However, the opposite situation was happening to CS. Considering their high yields and stable structure, the characteristic fragment ions m/z 176.1 and 190.1 were used as diagnostic daughter ions to create a MRM method for BR screening and identification. During the experiment, the candidate precursor ions of BR-DMAPBA were set according to the structures listed in Hayat’s book (Hayat, 2010).
Figure 4.
MS/MS spectra and proposed fragment pathways of BL-DMAPBA (A) and CS-DMAPBA (B). Data were obtained on UPLC-QTOF-MS working in resolution mode. The spectra were generated by combination of 15 scans. Leu-enkephalin was used as lock mass in MS/MS mode (m/z 278.1141 and 556.2771 for positive ion mode) to ensure the accuracy of m/z. [See online article for color version of this figure.]
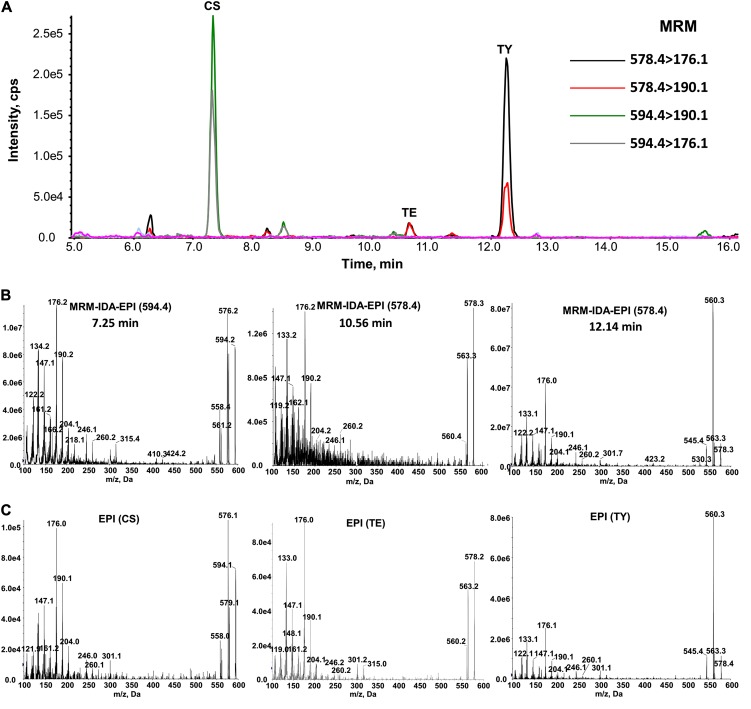
The established MRM method was then used to monitor the naturally occurring BRs in 1 g of rice ‘Nipponbare’ panicles to verify the efficiency of our new protocol. MRM signal-triggered enhanced product ion (EPI) scan was acquired to verify the potential BR candidate qualitatively. The results of CS, TE, and TY were depicted in Figure 5. As is seen, the MRM-triggered EPI spectra of three endogenous BRs (Fig. 5B) exhibited the same fragment ion pattern with the spectra of CS, TE, and TY (Fig. 5C). In addition, other potential BRs could be monitored by MRM mode with the diagnostic transitions (Supplemental Fig. S2). Further high-resolution m/z information of these precursor ions was obtained on quadrupole time-of-flight (QTOF)-MS (Supplemental Fig. S3). The accurate m/z enabled that these compounds were proposed to be 3-dehydro-6-deoxo-teasterone, 6-deoxo-dolichosterone, 6-deoxo-castasterone,28-homo-typhasterol/28-homo-teasterone, or their isomers (Supplemental Table S2). These results indicated that the new strategy could profile a wide range of vicinal diol-containing BRs in real plant samples efficiently.
Figure 5.
Identification of CS, TE, and TY from 1 g of rice panicles (see conditions in “Materials and Methods”). A, Monitoring of derivatized CS (594.4 > 176.1, 594.4 > 190.1), TE, and TY (578.4 > 176.1, 578.4 > 190.1) in rice panicles by MRM mode. B, MRM-triggered EPI spectra of derivatized CS, TE, and TY in extracts of rice panicles. C, EPI spectra of derivatized CS, TE, and TY standards. [See online article for color version of this figure.]
Hybrid Quantitation Strategy for BRs Analysis with UPLC-MRM3-MS
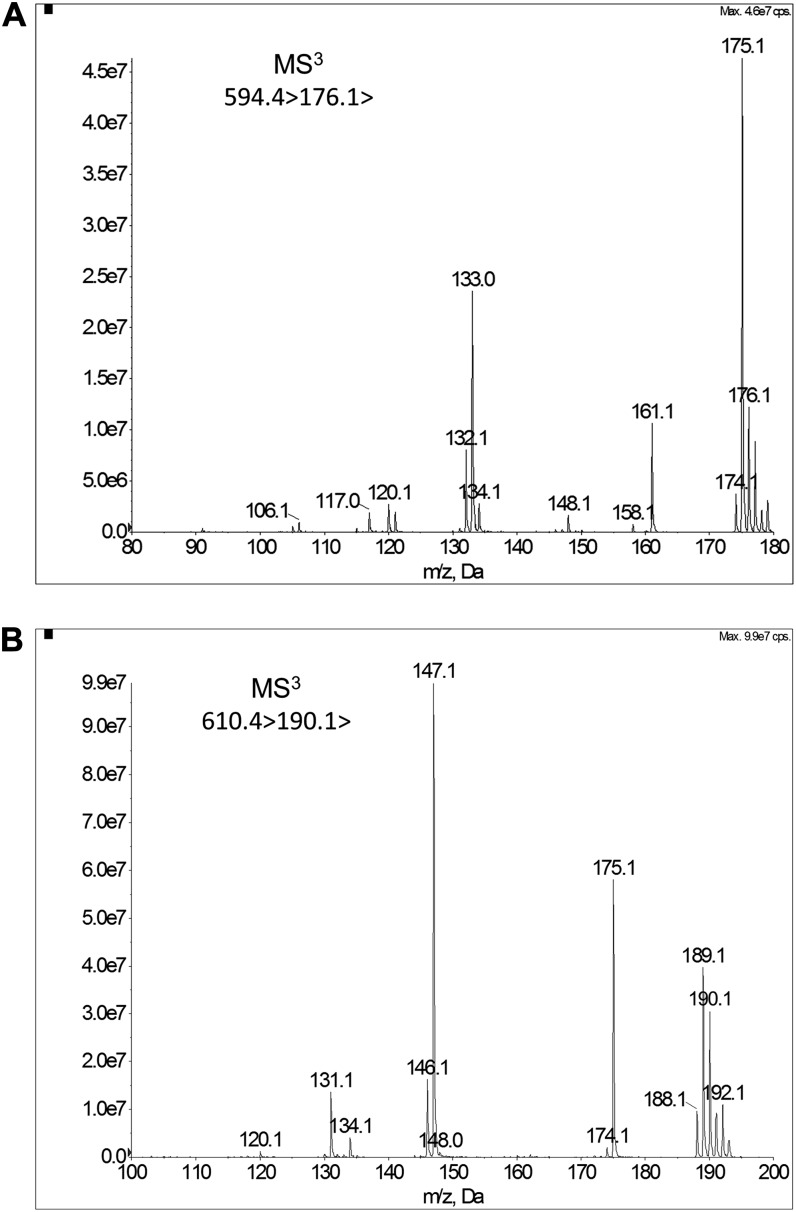
The efficient extraction, purification, and derivatization process for plant materials pretreatment guaranteed profiling natural BRs quantitatively with the UPLC-MS method. Generally, quantification methods using UPLC-MS under MRM mode can eliminate coeluting interferences efficiently and provide ideal UPLC-MS/MS chromatogram with low baseline. However, considering the ultra-low concentration of BRs and the complicated matrix of plant tissues, to obtain better quantification results, the MRM3 quantitation approach was employed to further filter the interferences from matrix with the QTRAP MS system. When the system is operated in MRM3 mode, Q1 filters the precursor ion and generates product ions in the Q2 region, the characteristic secondary product ion is trapped in Q3 for multistage MS (MS/MS/MS) scan, and then the Q3 acts as a linear ion trap (LIT) MS for excitation of the third stage characteristic ions detection. Through comparing the workflow of MRM3 with MRM mode, it is obvious that MRM3 provides higher selectivity without making a compromise on sensitivity due to ion accumulation in the LIT. (Note: The symbol of “greater than” is not a mathematical symbol in this paper, it means the fragment way of specific precursor ion). To set up the UPLC-MRM3-MS method for BRs quantitation, MS/MS/MS scan of m/z 610.4>190.1> and m/z 594.4>176.1> was investigated to determine the most sensitive MRM3 transition and the optimized excitation energy in the LIT. As is shown in Figure 6, transitions 610.4>190.1>147.1 and 594.4>176.1>133.0 were used for quantitation analysis of BL and CS. For TY and TE, the sum of transitions 578.4>190.1>147.1 and 578.4>176.1>133.0 was monitored. The MRM3 operating parameters were also optimized (see “Materials and Methods”).
Figure 6.
MS/MS/MS spectra of CS and BL. The MS/MS/MS scan was performed on the Qtrap-MS system. A, 594.4>176.1> of CS. The excitation energy was 0.11 V, and the fill time was 50 ms. B, 610.4>190.1> of BL. The excitation energy was 0.11 V, and the fill time was 50 ms.
Quantification method based on isotope dilution is the main stream for plant hormone analysis. However, the total organic synthesis of internal standards labeled with stable isotope, especially the multiple chiral centers-containing BRs, is a challenge for organic chemists. Considering the availability of deuterium-labeled BR standards, a hybrid quantification strategy was presented for quantitative analysis of BL, CS, TY, and TE.
For BL and CS, they were quantified based on an isotope dilution method using D3-BL and D3-CS as internal standards, respectively. To validate the overall proposed method, including MAX-MCX purification, derivatization, and UPLC-MRM3-MS analysis, a series of different amounts of commercial available D3-BL and D3-CS were added into ground plant tissues to undergo the whole process. The mean areas of the detected D3-BRs (n = 3) were plotted against D3-BR concentrations to generate a calibration curve (Table I). Good linearities were obtained with coefficients 0.9988 and 0.9993 for D3-BL and D3-CS, respectively. The limits of quantification (LOQs, signal to noise ratio [S/N]) of BL and CS are 1.7 pg g–1 FW and 3.9 pg g–1 FW, respectively, which are suitable for quantitative analysis of BL and CS under most circumstances. Relative standard deviation (RSD) of the peak areas of endogenous CS in 18 duplicates of the same plant sample was determined to be 7.03%, indicating the good reproducibility of the method.
Table I. Linear regression equations and LOQ data of the UPLC-MRM3-MS method.
Since stable isotope-labeled TE and TY were commercially unavailable, it was impossible to analyze the TE and TY with an isotope dilution approach. Therefore, D3-CS was used as the internal standard for the measurement of TE and TY because of its similar chemical structure, polarity, chromatographic behavior, and MS response to TY and TE. The quantitative correction curves were first generated from the plots of TE and TY responses against CS response at different concentrations (Table II). The linear correlation factors for TY and TE were both above 0.999, indicating good linearities between their MS responses in a wide concentration range. Thus, considering both the quantitative correction factor and the recovery calibration factor, the endogenous TE and TY concentrations could be calculated following Equations 1 and 2, respectively. Subsequently, the LOQs for TE and TY could be calculated to be 1.4 pg g–1 FW and 2.6 pg g–1 FW, respectively.
 |
 |
where AD3-CS, ATE, and ATY represent the peak area of each compound; RCS, RTY, and RTE represent the recovery of each compound; mD3-CS represents the amount of D3-CS spiked; and mTY and mTE represent TY and TE measured in plant.
Table II. Quantitative correction curves and LOQ data of TY and TE.
ACS, ATE, and ATY represent the peak area of each compound with the same injection size. Recovery calibration factor was calculated from RCS/R, where R is the recovery of TE or TY and RCS was the recovery of CS.
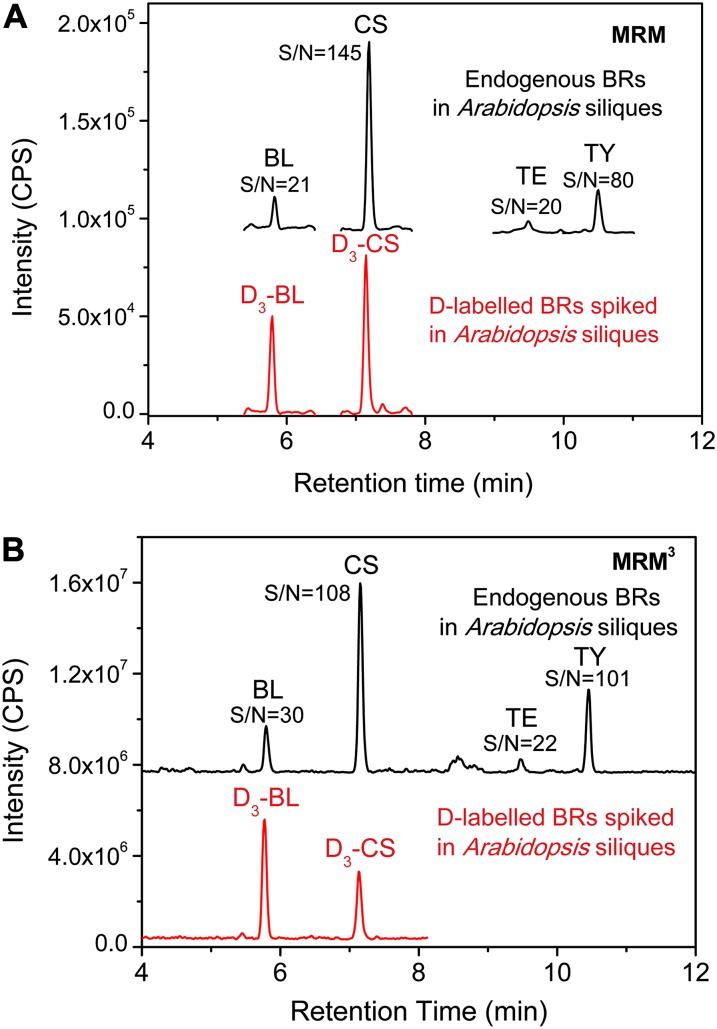
The hybrid quantification strategy for determining BRs using UPLC-MRM3-MS provided good detection results as is shown in Figure 7B. The S/N ratios of four major BRs were higher than that obtained with MRM mode, except for CS, which means the sensitivity was improved due to elimination of more interferences using the MRM3 mode. However, the UPLC-MRM-MS-based method could also provide acceptable quantitative analysis results for the four major bioactive BRs, with all S/N above 20 (Fig. 7A), which indicates the experiment can be performed in most biological laboratories with a common triple quadrupole mass spectrometer.
Figure 7.
UPLC-MRM-MS (A) and UPLC-MRM3-MS (B) detection of BR-DMAPBA from 1 g of Arabidopsis siliques (see conditions in Table III). CPS, Counts per second. [See online article for color version of this figure.]
In summary, the hybrid quantification strategy with a combined isotope dilution and internal standard approach using UPLC-MRM3-MS provided a sensitive, precise, and reproducible quantification method for measurement of BRs in plant tissues.
Organ-Specific Distribution Measurement of BRs in Arabidopsis and Rice
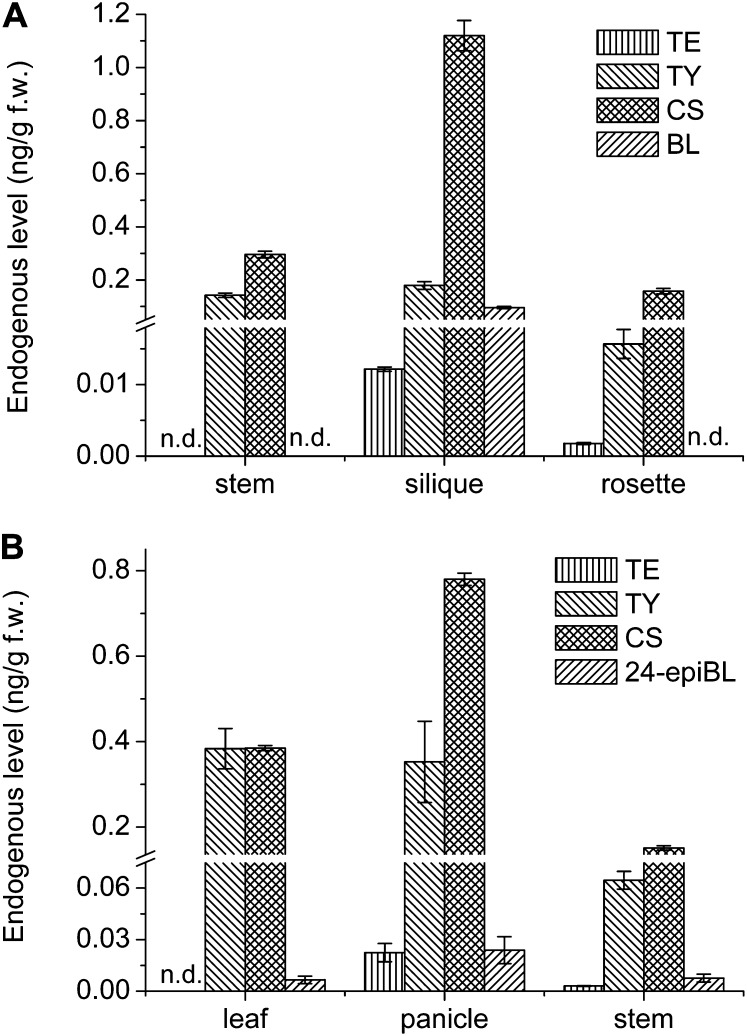
When the new method was well established, it was applied to model plants such as Arabidopsis and rice to measure BRs in different tissues or organs. The spatial distribution of 24-epiBL/BL, CS, TE, and TY were profiled in wild-type Arabidopsis ecotype Columbia (Col-0) and rice ‘Nipponbare’ to verify the wide applicability of the improved method consisting of MAX-MCX purification strategy, DMAPBA derivatization, and hybrid quantification strategy using UPLC-MRM3-MS (Fig. 8). BL was determined to be 0.096 ± 0.004 ng g–1 FW in Arabidopsis siliques, which is more stable and reliable than the data in previous literature (Noguchi et al., 1999). BL was not detected in all the tissues of rice, which is in accordance with previous reports (Shimada et al., 2003; Kim et al., 2006). However, the epimer of BL, 24-epiBL, was detected in the leaf, panicle, and stem of rice. The concentration of TE in the rosette of Arabidopsis was determined to be 0.0016 ng g–1 FW with a low RSD of 7.6%. The stable measurement of TE indicates the efficiency of the new method.
Figure 8.
Endogenous levels of BRs in different tissues of rice and Arabidopsis. All results were obtained from 1 g of plant tissues. Samples were analyzed with three replicates. Error bars represent the sd. A, Wild-type Arabidopsis Col-0; B, wild-type rice ‘Nipponbare.’ (The isomeric form of BL, 24-epiBL, was determined in rice [Kim et al., 2008].)
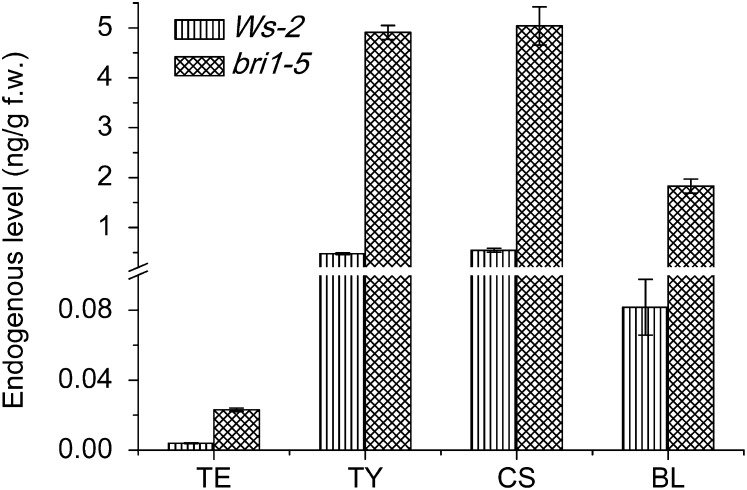
To further confirm the reliability and applicability of the method, the measurement of BRs in siliques of Wassilewskija-2 (Ws-2) ecotype and its BR-insensitive mutant bri1-5 was performed. As is seen in Figure 9 and Supplemental Figure S4, all four major BRs could be quantified precisely with RSD lower than 15% by this method. As is expected, bri1-5 plants accumulated more than 5 times higher levels of four major BRs than the WS-2 wild type, which was in good consistence with previous reports (Noguchi et al., 1999). The results were averages of three duplicates, which made the results more accurate and reliable than previous reports (Hong et al., 2005; Bancos et al., 2006; Kim et al., 2006). This could be attributed to the high sensitivity and high throughput of our new method, which guaranteed the stable detection in only 1 g of plant tissues. In addition, the high S/N ratio of quantification results in bri1-5 indicated that BRs could be determined in less than 100 mg for BR accumulated mutants.
Figure 9.
Endogenous levels of BRs in WS-2 and bri1-5 Arabidopsis siliques. Samples were analyzed with three replicates. Error bars represent the sd.
CONCLUSION
In this work, a simplified high-sensitivity method for BR quantification has been established and validated to measure BL, CS, TY, and TE in 1 g model plants such as Arabidopsis and rice based on efficient MAX-MCX SPE purification, high-sensitivity derivatization, and a hybrid quantitation strategy using UPLC-MRM3-MS. The consumption of plant materials could be drastically reduced to 1 g without loss of sensitivity compared with previous reports (Hong et al., 2005; Bancos et al., 2006; Kim et al., 2006). The throughput was also improved dramatically because of the simplified sample pretreatment process. The new method will lead to more accurate and reliable BR measurement results because biological replicate experiments are more practically feasible with it. The new method was validated via analysis of BRs in wild-type and mutant model plants. The results of BR distribution in different tissues and concentration changes in different gene background mutants show that the new strategy can be applied for monitoring the endogenous BRs within less plant materials and provide solid evidence for deeper understanding of the roles of BRs acting in plants. The pipeline of the whole experiment is easy to follow. It is believed that the in-depth physiological study of BRs will benefit from this well-developed quantification analysis method.
MATERIALS AND METHODS
Chemicals
BL, CS, TE, and TY were bought from Chemiclones, Inc. D3-BL and D3-CS were from OlChemIm Ltd. DMAPBA and APBA were purchased from TCI Development Co. Ltd. and PyBA from Sigma-Aldrich. MeOH and ACN (HPLC grade) were from Fisher Scientific. Deionized water purified by the Elga Purelab water purification system (resistivity > 18.2 MΩ) was used for all experiments.
Plant Materials
Wild-type Col-0, wild-type Ws-2, and the bri1-5 mutant of Arabidopsis (Arabidopsis thaliana) were grown on soil at 22°C under a 16-h/8-h long-day condition for 5 weeks. For analysis of endogenous levels of BRs in different tissues, immature siliques, stems, and rosette leaves of 5 week old were collected separately and quickly frozen in liquid nitrogen for further processing for BR purification.
Wild-type rice (Oryza sativa) was grown in a farm and harvested during flowering. For spatial distribution of BRs and screening of all BRs, panicles, leaves, and stems were isolated and then collected.
Purification and Derivatization of BRs from Plant Materials
The collected plant tissues were first ground to a fine powder with a MM-400 mixer milling (Retsch). One gram of the plant material powder was extracted with 6.25 mL of 95% (v/v) aqueous methanol twice. For quantification of BRs, D3-BL (250 pg) and D3-CS (500 pg) were added to the extract as internal standards. For screening of BRs, no internal standards were added.
MAX and MCX Cartridges (6 mL and 500 mg) were purchased from Waters. The MAX cartridge was activated and equilibrated with methanol, water, 1 M KOH, 10% (v/v) MeOH, and 95% (v/v) MeOH in turn, and MCX with methanol, water, 5% (v/v) FA, and 10% (v/v) MeOH. Then, the crude plant extracts were passed through a MAX column and collected to be dried by N2 chilling. After the collection was reconstructed in 4 mL of 10% (v/v) methanol, it was loaded onto the equilibrated MCX cartridge. After sequential washing with 5% (v/v) FA in 5% (v/v) methanol, 5% (v/v) methanol, 5% (v/v) NH4OH in 5% (v/v) methanol, and 5% (v/v) methanol, BRs were eluted with 80% (v/v) methanol. The elution was dried and then dissolved in 200 μL of ACN to be derivatized with 30 μg DMAPBA.
UPLC-MRM3-MS and UPLC-MRM-MS Method for Quantitation of BRs
BR-DMAPBA detection was performed on a UPLC (Waters) combined with a 5500 Qtrap MS equipped with an ESI source (AB SCIEX). Five microliters of each sample were injected onto a BEH C18 column (100 mm × 2.1 mm, 1.7 μm). The inlet method was set as follows: mobile phase A, 0.05% (v/v) acetic acid in water and B, 0.05% (v/v) acetic acid in ACN. Gradient: 0 to 3 min, 65% B to 75% B; 3 to 11 min, 75% B to 95% B; 11 to 12 min, 95% B; 12 to 13.5 min, 95% B to 65% B; and 13.5 to 16 min, 65% B. BR-DMAPBA was detected in positive MRM3/MRM mode. The ESI source parameters were set as: ion spray voltage, 5500 V; desolvation temperature, 550°C; nebulizing gas 1, 45; desolvation gas 2, 45; and curtain gas, 27. When detected in MRM mode and MRM3 mode, the optimized parameters were listed in Tables III and IV.
Table III. Optimized MRM parameters for BR-DMAPBA.
| Compounds | Q1/Q3 | Collision Energy | Declustering Potential | Entrance Potential | Collision Cell Exit Potential |
|---|---|---|---|---|---|
| V | |||||
| BL-DMAPBA | 610.40/190.1 | 55 | 35 | 10 | 12 |
| 24-epiBL-DMAPBA | 610.45/190.1 | 55 | 35 | 10 | 12 |
| D3-BL-DMAPBA | 613.40/190.1 | 55 | 35 | 10 | 12 |
| CS-DMAPBA | 594.50/190.1 | 60 | 15 | 10 | 12 |
| D3-CS-DMAPBA | 597.50/190.1 | 60 | 15 | 10 | 12 |
| TE-DMAPBA | 578.45/190.1 | 56 | 10 | 10 | 12 |
| TY-DMAPBA | 578.40/176.1 | 62 | 15 | 10 | 12 |
Table IV. Optimized MRM3 parameters for BR-DMAPBA.
| Compounds | Transition | Collision Energy | Declustering Potential | Entrance Potential | Excitation Energy | Fixed Fill Time |
|---|---|---|---|---|---|---|
| V | ms | |||||
| BL-DMAPBA | 610.4/190.1/147.1 | 55 | 30 | 10 | 0.11 | 150 |
| D3-BL-DMAPBA | 613.4/190.1/147.1 | 55 | 30 | 10 | 0.11 | 150 |
| CS-DMAPBA | 594.4/176.1/133.1 | 70 | 10 | 10 | 0.11 | 150 |
| D3-CS-DMAPBA | 597.4/176.1/133.1 | 70 | 10 | 10 | 0.11 | 150 |
| TE-DMAPBA | 578.4/176.1/133.1 | 57 | 10 | 10 | 0.11 | 150 |
| 578.4/190.1/147.1 | 70 | 10 | 10 | 0.11 | 150 | |
| TY-DMAPBA | 578.4/176.1/133.1 | 62 | 10 | 10 | 0.11 | 150 |
| 578.4/190.1/147.1 | 69 | 10 | 10 | 0.11 | 150 | |
Targeted Screening of BR Compounds in Rice Panicles
To check the coverage of the purification protocol, the UPLC method was adjusted to obtain a higher peak capacity. The gradient profile setting was as follows: 0 to 17.5 min, 70% B to 95% B; 17.5 to 19.0 min, 95% B; 19.0 to 20.5 min, 95% B to 70% B; and 20.5 to 23.5 min, 70% B.
When performing information-dependent acquisition of enhanced product ion experiment, Q3 masses were set as 190.1 and 176.1, while Q1 masses were ranged from 548.4 to 624.4 according to the structure reported in the literature (Bajguz and Tretyn, 2003). When MRM response exceeds 1,000 counts per second, EPI scan from 100 to 650 will be triggered to record all the fragment ions. Collision energy was set to be 70 with a spread at 5, and Q3 LIT was dynamically filled.
When performing accurate mass determination of BRs, UPLC-QTOF-MS (Synapt G2 HDMS, Waters) equipped with an ESI source was used. The UPLC method was similarly set to the above description. All experiments were performed in positive resolution mode to give a resolution at 20,000. To ensure the accurate mass analysis, Leu-enkephalin was used as lock mass in MS/MS mode (m/z 278.1141 and 556.2771 for positive ion mode) at a concentration of 200 pg mL–1 at 10 μL min–1. The source parameters were set as follows: capillary voltage, 3,000 V; sampling cone, 40 V; extraction cone, 4 V; source temperature, 100°C; desolvation temperature, 350°C; cone gas, 50 L h–1; and desolvation gas, 800 L h–1. The elemental composition of screened accurate masses obtained from the MS scan was analyzed by the Elemental Composition function of Masslynx software. The results were generated with mass tolerance within 3 ppm (mass error, Δm/m), and three peaks were used to give an isotope fit value. The element limits were set as follows: C, 30 to 40; H, 45 to 65; O, 3 to 8; N, 1 to 2; and B, 1 and 2.
Supplemental Data
The following materials are available in the online version of this article.
Supplemental Figure S1. LOD and LOQ of 24-epiBL detected with APCI.
Supplemental Figure S2. Monitoring of other BRs by MRM mode in rice panicles with the diagnostic transitions of [M+H]+>176.1 and [M+H]+>190.1.
Supplemental Figure S3. High-resolution monitoring of the precursor ions of BRs-DMAPBA in rice panicles on QTOF-MS.
Supplemental Figure S4. Representative MRM3 chromatograms of BRs from 1 g of Arabidopsis siliques.
Supplemental Table S1. Effect of the amount of DMAPBA on the MS responses of endogenous TE and TY in rice panicles.
Supplemental Table S2. Elemental formula annotation of the monitored ions and the proposed structure.
Acknowledgments
We thank Qi Xie (Institute of Genetics and Developmental Biology, Chinese Academy of Sciences) for generous sharing of bri1-5 Arabidopsis seed stocks.
Glossary
- BR
brassinosteroid
- UPLC
ultra-performance liquid chromatography
- MS
mass spectrometry
- MRM
multiple reaction monitoring
- SPE
solid-phase extraction
- BL
brassinolide
- CS
to castasterone
- TE
teasterone
- TY
typhasterol
- MAX
mixed-mode anion exchange
- MCX
cation exchange
- MRM3
multiple reaction monitoring
- ESI
electrospray ionization
- pg
picogram
- PyBA
3-pyridylboronic acid
- APBA
3-aminophenylboronic acid
- DMAPBA
3-(dimethylamino)-phenylboronic acid
- 24-epiBL
the 24- epibrassinolide isomer of BL
- ACN
acetonitrile
- FW
fresh weight
- FA
formic acid
- MS/MS
tandem-MS
- m/z
mass-to-charge ratio
- EPI
enhanced product ion
- QTOF
quadrupole time-of-flight
- LIT
linear ion trap
- MS/MS/MS
multistage MS
- LOQ
limit of quantification
- RSD
relative standard deviation
- Col-0
ecotype Columbia
- MS/MS
tandem-MS
- MS/MS/MS
multistage MS
- S/N
signal to noise ratio
- RSD
relative standard deviation
- Ws-2
Wassilewskija-2
References
- Bajguz A, Tretyn A. (2003) The chemical characteristic and distribution of brassinosteroids in plants. Phytochemistry 62: 1027–1046 [DOI] [PubMed] [Google Scholar]
- Bancos S, Szatmári AM, Castle J, Kozma-Bognár L, Shibata K, Yokota T, Bishop GJ, Nagy F, Szekeres M. (2006) Diurnal regulation of the brassinosteroid-biosynthetic CPD gene in Arabidopsis. Plant Physiol 141: 299–309 [DOI] [PMC free article] [PubMed] [Google Scholar]
- Fujioka S, Yokota T. (2003) Biosynthesis and metabolism of brassinosteroids. Annu Rev Plant Biol 54: 137–164 [DOI] [PubMed] [Google Scholar]
- Fujita S, Ohnishi T, Watanabe B, Yokota T, Takatsuto S, Fujioka S, Yoshida S, Sakata K, Mizutani M. (2006) Arabidopsis CYP90B1 catalyses the early C-22 hydroxylation of C27, C28 and C29 sterols. Plant J 45: 765–774 [DOI] [PubMed] [Google Scholar]
- Grove MD, Spencer GF, Rohwedder WK, Mandava N, Worley JF, Warthen JD, Steffens GL, Flippenanderson JL, Cook JC. (1979) Brassinolide, a plant growth-promoting steroid isolated from Brassica napus pollen. Nature 281: 216–217 [Google Scholar]
- Hayat S (2010) Brassinosteroids: A Class of Plant Hormone. Springer-Verlag, Berlin [Google Scholar]
- Hong Z, Ueguchi-Tanaka M, Fujioka S, Takatsuto S, Yoshida S, Hasegawa Y, Ashikari M, Kitano H, Matsuoka M. (2005) The rice brassinosteroid-deficient dwarf2 mutant, defective in the rice homolog of Arabidopsis DIMINUTO/DWARF1, is rescued by the endogenously accumulated alternative bioactive brassinosteroid, dolichosterone. Plant Cell 17: 2243–2254 [DOI] [PMC free article] [PubMed] [Google Scholar]
- Hong Z, Ueguchi-Tanaka M, Umemura K, Uozu S, Fujioka S, Takatsuto S, Yoshida S, Ashikari M, Kitano H, Matsuoka M. (2003) A rice brassinosteroid-deficient mutant, ebisu dwarf (d2), is caused by a loss of function of a new member of cytochrome P450. Plant Cell 15: 2900–2910 [DOI] [PMC free article] [PubMed] [Google Scholar]
- Huo F, Wang X, Han Y, Bai Y, Zhang W, Yuan H, Liu H. (2012) A new derivatization approach for the rapid and sensitive analysis of brassinosteroids by using ultra high performance liquid chromatography-electrospray ionization triple quadrupole mass spectrometry. Talanta 99: 420–425 [DOI] [PubMed] [Google Scholar]
- Hwang JY, Park CH, Namgung H, Kim SK. (2006) Identification of a new brassinosteroid, 23-dehydro-2-epicastasterone, from immature seeds of Phaseolus vulgaris. J Plant Biol 49: 409–412 [Google Scholar]
- Kim BK, Fujioka S, Takatsuto S, Tsujimoto M, Choe S. (2008) Castasterone is a likely end product of brassinosteroid biosynthetic pathway in rice. Biochem Biophys Res Commun 374: 614–619 [DOI] [PubMed] [Google Scholar]
- Kim HB, Kwon M, Ryu H, Fujioka S, Takatsuto S, Yoshida S, An CS, Lee I, Hwang I, Choe S. (2006) The regulation of DWARF4 expression is likely a critical mechanism in maintaining the homeostasis of bioactive brassinosteroids in Arabidopsis. Plant Physiol 140: 548–557 [DOI] [PMC free article] [PubMed] [Google Scholar]
- Kim TW, Wang ZY. (2010) Brassinosteroid signal transduction from receptor kinases to transcription factors. Annu Rev Plant Biol 61: 681–704 [DOI] [PubMed] [Google Scholar]
- Kwon M, Choe S. (2005) Brassinosteroid biosynthesis and dwarf mutants. J Plant Biol 48: 1–15 [Google Scholar]
- Lee SC, Kim TW, Hwang JY, Park CH, Son SH, Youn JH, Kim SK. (2010) Identification and biosynthesis of cholest-4-en-3-one and 6-oxocholetanol in young tomato plants. Bull Korean Chem Soc 31: 1782–1784 [Google Scholar]
- Mitchell JW, Mandava N, Worley JF, Plimmer JR, Smith MV. (1970) Brassins—a new family of plant hormones from rape pollen. Nature 225: 1065–1066 [DOI] [PubMed] [Google Scholar]
- Noguchi T, Fujioka S, Choe S, Takatsuto S, Tax FE, Yoshida S, Feldmann KA. (2000) Biosynthetic pathways of brassinolide in Arabidopsis. Plant Physiol 124: 201–209 [DOI] [PMC free article] [PubMed] [Google Scholar]
- Noguchi T, Fujioka S, Choe S, Takatsuto S, Yoshida S, Yuan H, Feldmann KA, Tax FE. (1999) Brassinosteroid-insensitive dwarf mutants of Arabidopsis accumulate brassinosteroids. Plant Physiol 121: 743–752 [DOI] [PMC free article] [PubMed] [Google Scholar]
- Nomura T, Kushiro T, Yokota T, Kamiya Y, Bishop GJ, Yamaguchi S. (2005) The last reaction producing brassinolide is catalyzed by cytochrome P-450s, CYP85A3 in tomato and CYP85A2 in Arabidopsis. J Biol Chem 280: 17873–17879 [DOI] [PubMed] [Google Scholar]
- Sakamoto T, Morinaka Y, Ohnishi T, Sunohara H, Fujioka S, Ueguchi-Tanaka M, Mizutani M, Sakata K, Takatsuto S, Yoshida S, et al. (2006) Erect leaves caused by brassinosteroid deficiency increase biomass production and grain yield in rice. Nat Biotechnol 24: 105–109 [DOI] [PubMed] [Google Scholar]
- Shimada Y, Goda H, Nakamura A, Takatsuto S, Fujioka S, Yoshida S. (2003) Organ-specific expression of brassinosteroid-biosynthetic genes and distribution of endogenous brassinosteroids in Arabidopsis. Plant Physiol 131: 287–297 [DOI] [PMC free article] [PubMed] [Google Scholar]
- Svatos A, Antonchick A, Schneider B. (2004) Determination of brassinosteroids in the sub-femtomolar range using dansyl-3-aminophenylboronate derivatization and electrospray mass spectrometry. Rapid Commun Mass Spectrom 18: 816–821 [DOI] [PubMed] [Google Scholar]
- Symons GM, Ross JJ, Jager CE, Reid JB. (2008) Brassinosteroid transport. J Exp Bot 59: 17–24 [DOI] [PubMed] [Google Scholar]
- Tanabe S, Ashikari M, Fujioka S, Takatsuto S, Yoshida S, Yano M, Yoshimura A, Kitano H, Matsuoka M, Fujisawa Y, et al. (2005) A novel cytochrome P450 is implicated in brassinosteroid biosynthesis via the characterization of a rice dwarf mutant, dwarf11, with reduced seed length. Plant Cell 17: 776–790 [DOI] [PMC free article] [PubMed] [Google Scholar]
- Tang W, Deng Z, Wang ZY. (2010) Proteomics shed light on the brassinosteroid signaling mechanisms. Curr Opin Plant Biol 13: 27–33 [DOI] [PMC free article] [PubMed] [Google Scholar]
- Tong H, Chu C. (2012) Brassinosteroid signaling and application in rice. J Genet Genomics 39: 3–9 [DOI] [PubMed] [Google Scholar]
- Wu CY, Trieu A, Radhakrishnan P, Kwok SF, Harris S, Zhang K, Wang JL, Wan JM, Zhai HQ, Takatsuto S, et al. (2008) Brassinosteroids regulate grain filling in rice. Plant Cell 20: 2130–2145 [DOI] [PMC free article] [PubMed] [Google Scholar]
- Xin P, Yan J, Fan J, Chu J, Yan C. (2013) A dual role of boronate affinity in high-sensitivity detection of vicinal diol brassinosteroids from sub-gram plant tissues via UPLC-MS/MS. Analyst 138: 1342–1345 [DOI] [PubMed] [Google Scholar]
- Yamamuro C, Ihara Y, Wu X, Noguchi T, Fujioka S, Takatsuto S, Ashikari M, Kitano H, Matsuoka M. (2000) Loss of function of a rice brassinosteroid insensitive1 homolog prevents internode elongation and bending of the lamina joint. Plant Cell 12: 1591–1606 [DOI] [PMC free article] [PubMed] [Google Scholar]


