Figure 5.
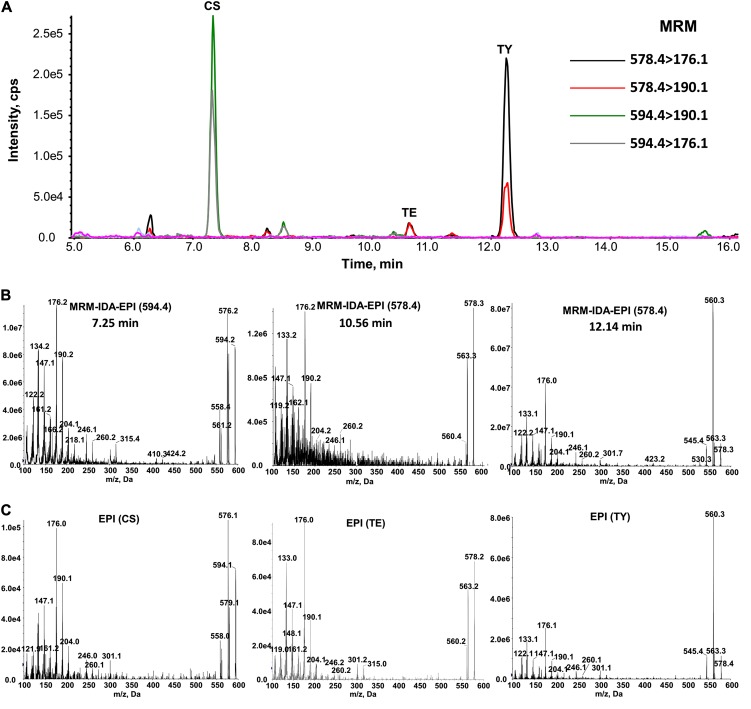
Identification of CS, TE, and TY from 1 g of rice panicles (see conditions in “Materials and Methods”). A, Monitoring of derivatized CS (594.4 > 176.1, 594.4 > 190.1), TE, and TY (578.4 > 176.1, 578.4 > 190.1) in rice panicles by MRM mode. B, MRM-triggered EPI spectra of derivatized CS, TE, and TY in extracts of rice panicles. C, EPI spectra of derivatized CS, TE, and TY standards. [See online article for color version of this figure.]

