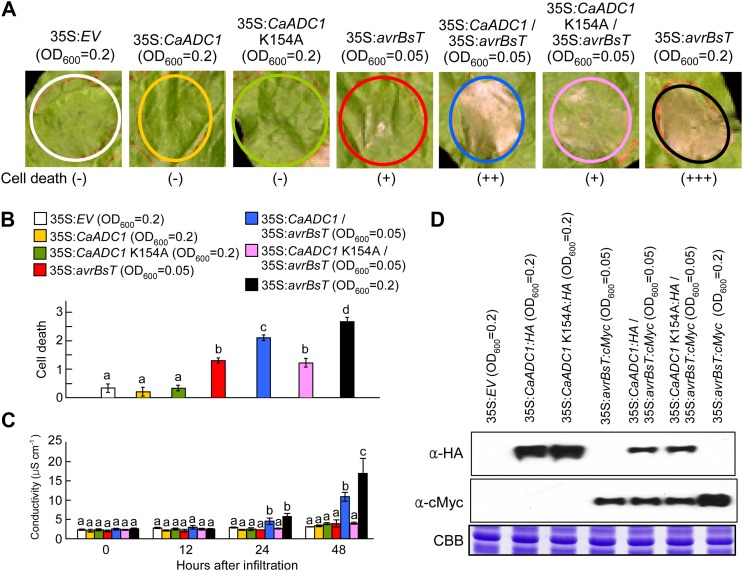
Figure 2.
Transient expression of CaADC1 promotes AvrBsT-triggered cell death. A, Cell death phenotypes. N. benthamiana leaves were infiltrated with A. tumefaciens carrying the indicated constructs at different inoculum ratios and photographed 2 d later. B, Cell death levels were rated based on a 0 to 3 scale: 0, no cell death (less than 10%); 1, weak cell death (10%–30%); 2, partial cell death (30%–80%); and 3, full cell death (80%–100%). Values represent averages of 10 samples. C, Electrolyte leakage from leaf discs at different time points after infiltration with A. tumefaciens carrying the indicated constructs at different inoculum ratios. Data are means ± sd from three independent experiments. Different letters indicate statistically significant differences (lsd; P < 0.05). D, Immunoblot analyses of the expression of 35S:avrBsT:cMyc, 35S:CaADC1:HA, and 35S:CaADC1 K154A:HA. Protein loading is visualized by Coomassie Brilliant Blue (CBB) staining. [See online article for color version of this figure.]

