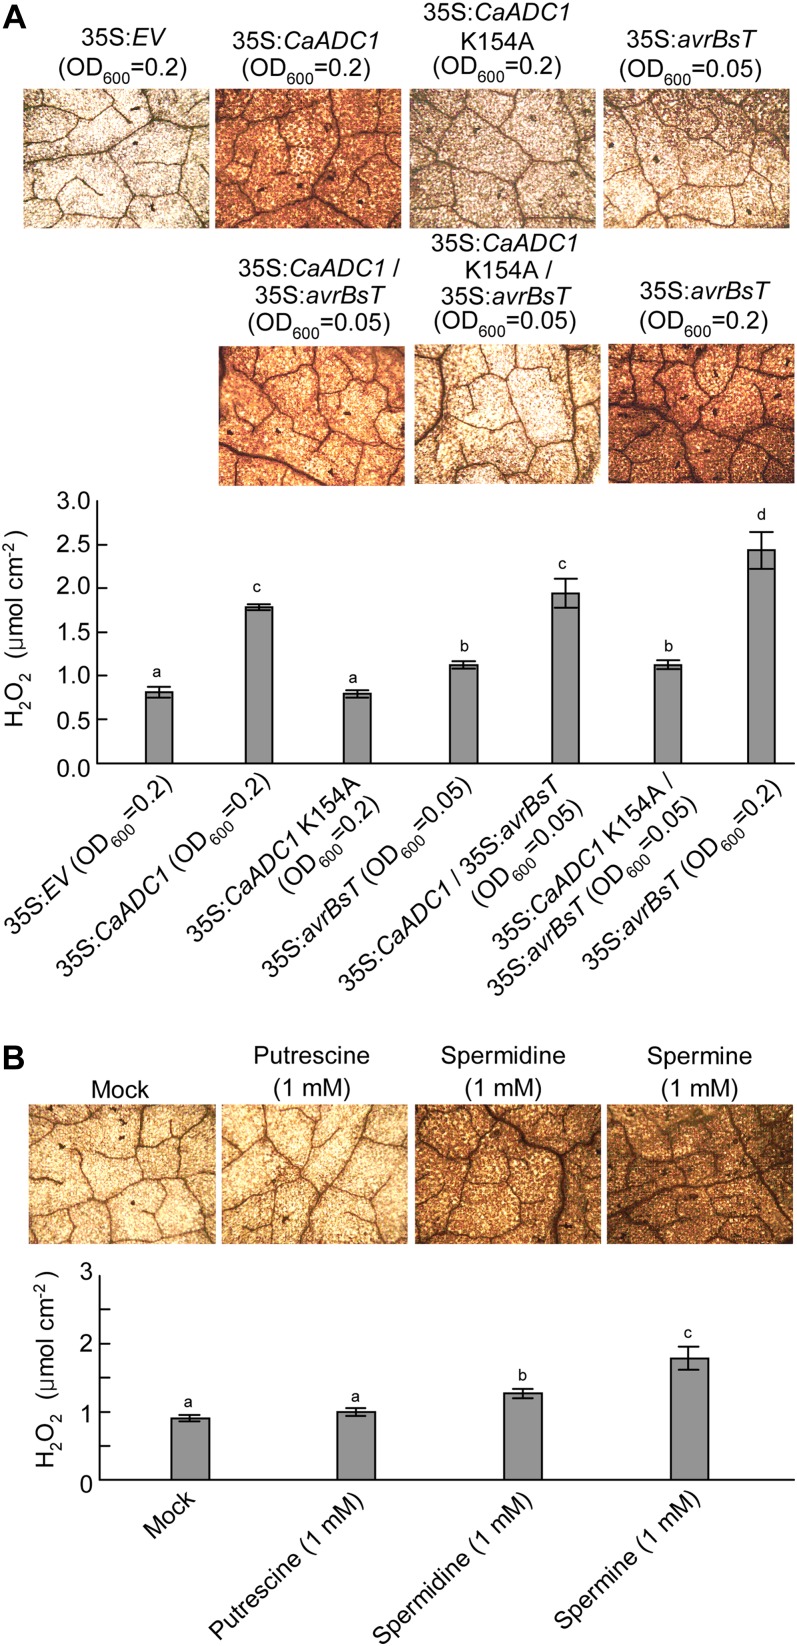
Figure 5.
Quantification of the H2O2 burst in N. benthamiana leaves 24 h after infiltration with either PAs or A. tumefaciens harboring the indicated constructs. Leaves were stained with DAB. H2O2 concentrations were quantified by xylenol orange analysis. Data are means ± sd from three independent experiments. Different letters indicate statistically significant differences (lsd; P < 0.05). A, Effect of the transient expression of CaADC1, CaADC1 K154A, or avrBsT on H2O2 production. B, Effect of PA treatment on H2O2 production. The mock control was treated with 10 mm MgCl2. [See online article for color version of this figure.]

