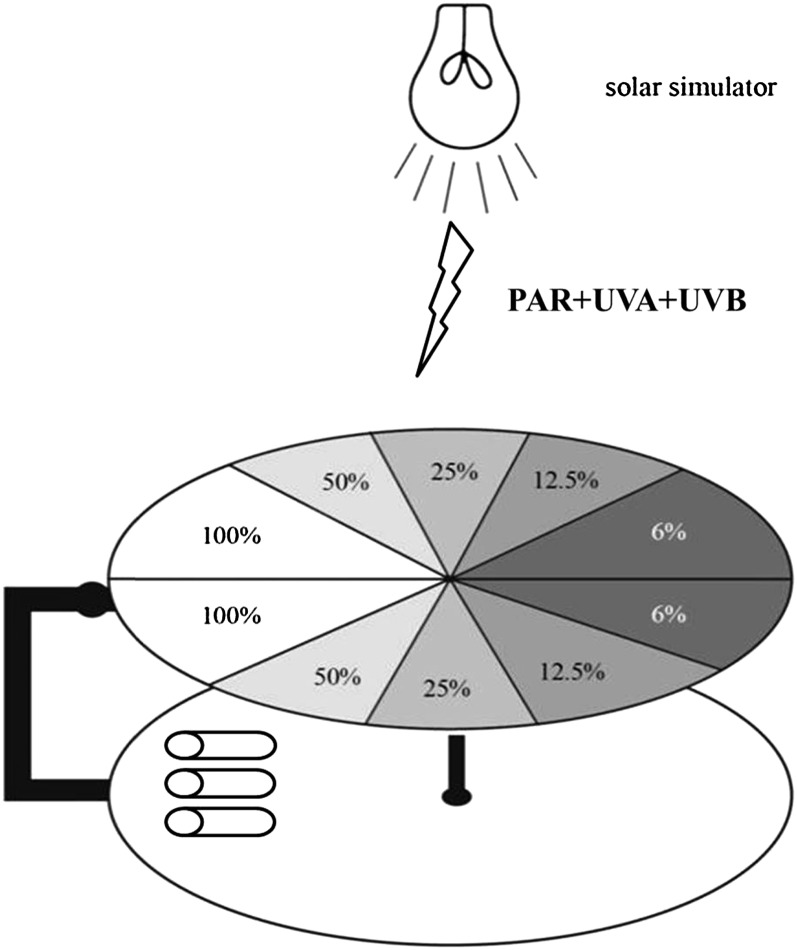
Figure 3.
Schematic of the cycling device used to impose fluctuations in simulated solar irradiance, ranging from 100% to 50%, 25%, 12.5%, and 6%, then from 6% back to 12.5%, 25%, 50%, and 100% during one cycle. The irradiances at 100% levels were PAR 120 (552 μmol photons m−2 s−1), UVA 32.3 W m−2, and UVB 1.525 W m−2. The rate of irradiance fluctuation was controlled by the cycling rate.

