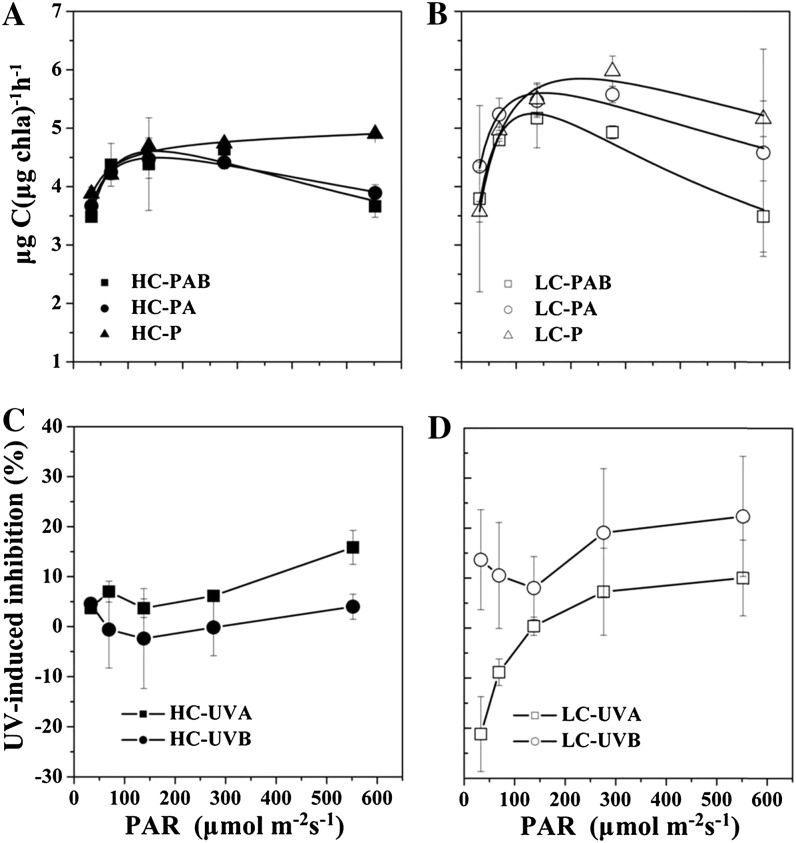
Figure 7.
A and B, Photosynthetic carbon fixation rates (μg carbon μg−1 chl a h−1) in G. oceanica grown in HC (A) and LC (B) conditions as a function of PAR under different radiation treatments over a 2-h incubation period. C and D, Inhibition of photosynthetic rates induced by UVA or UVB of HC-grown cells (C) and LC-grown cells (D) derived from the data plotted in A and B. Vertical lines represent sd of triplicate incubations.

