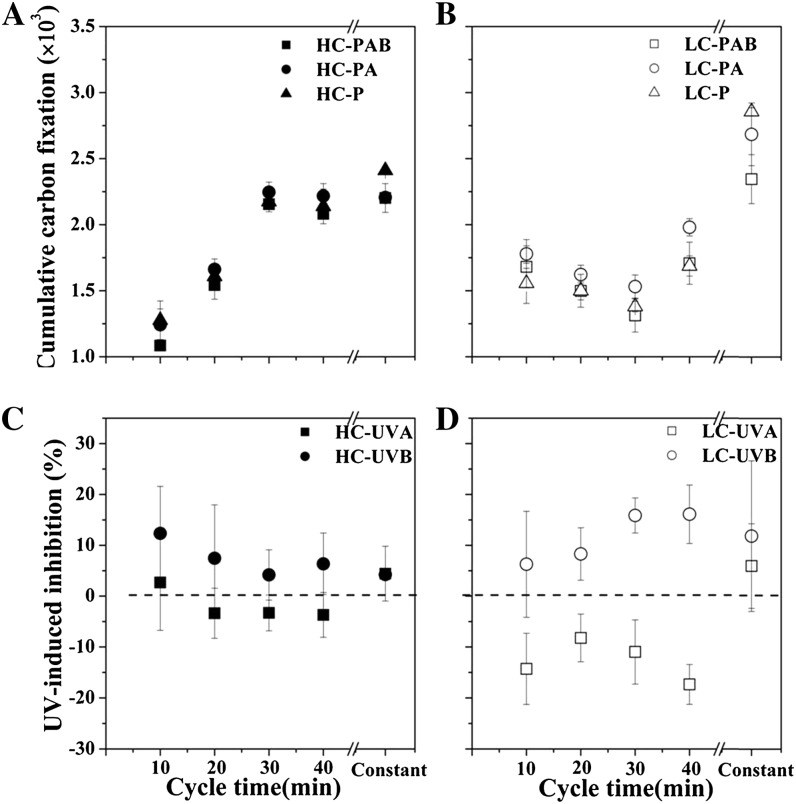
Figure 8.
A and B, Cumulative carbon fixation as a function of the cycling rate (minutes per cycle, over the 120-min treatment period) for HC-grown cells (A) and LC-grown cells (B) under three radiation treatments within the simulated UML. The values of static samples are shown as “Constant” for comparison. C and D, UVR inhibition of cumulative carbon fixation in HC-grown cells (C) and LC-grown cells (D) derived from the data plotted in A and B. The values are means and sd (n = 3).

