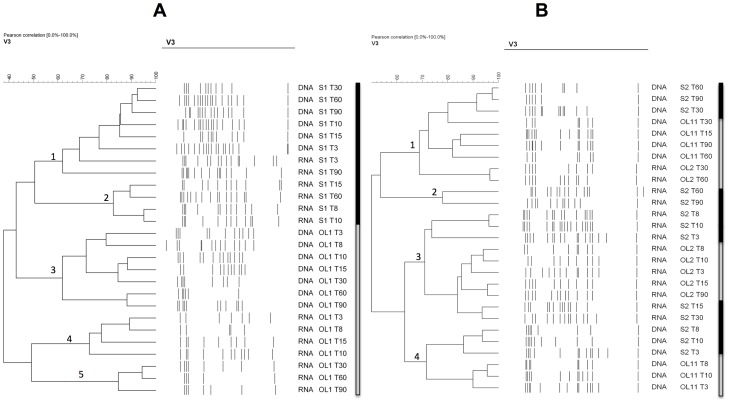
Figure 2. Digitalized DGGE profiles of the DNA and RNA extracted directly from olive surfaces and brines during the fermentation processes.
Panel A, untreated table olive fermentation; panel B, NaOH treated table olive fermentation. The identified clusters are indicated with numbers. The lines on the right of the dendrograms indicate the origin of the samples: gray, from the olives; black, from the brines. OL stands for olive surface and S for brine. The day of fermentation and the nucleic acid analyzed is also indicated in the code.

