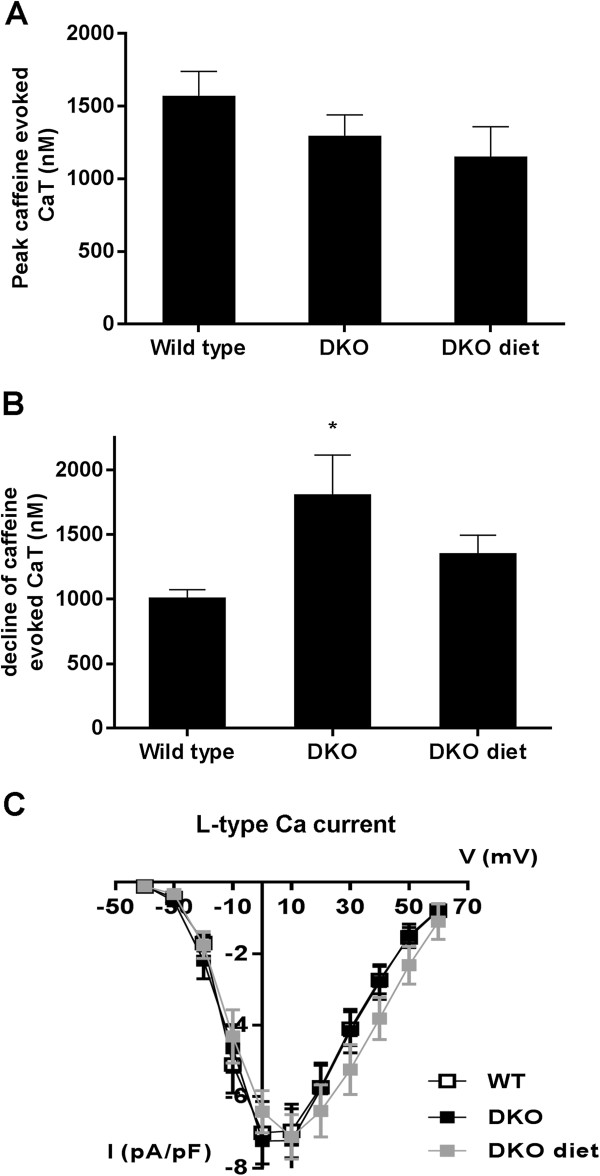
Figure 4.
SR Ca2+ content, NCX function and ICaL in WT, DKO and DKO undergoing hypocaloric diet. (A) Averaged data on SR Ca2+ content, measured as the peak caffeine-evoked CaT in WT (n=12), DKO (n =12) and DKO diet (n=12). (B) Pooled data on NCX function, estimated as the decline of the caffeine-induced CaT in WT (n=12), DKO (n=12) and DKO diet (n=12). (C) L-type Ca2+ current density (ICaL) expressed as a function of voltage in WT (n=11), DKO (n=8) and DKO diet (n=10). * denotes p<0.05 vs WT and £ p<0.05 vs. untreated DKO.

