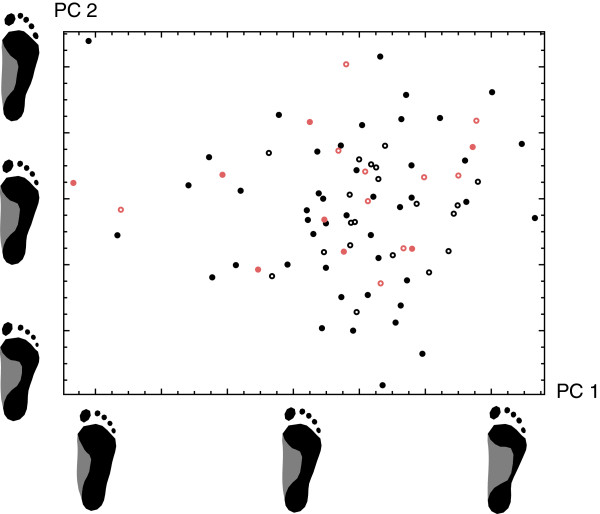
Figure 2.
Scatterplot of the first two principal components of footprint shape. The first principal component (visualized by the footprint shapes along the PC 1 axis) is a contrast between flatfeet (low PC 1 sores) and high-arched feet (high PC 1 scores), whereas PC 2 (visualized by the footprint shapes along the PC 2 axis) represents the differences between short and wide feet with short toes (low PC 2 scores) versus long and narrow feet with long toes (high PC 2 scores). The symbol type reflects the geographical origin of the individuals: the continental (filled black circles), the Adriatic (open black circles), and the Slavonian region of Croatia (filled red circles), as well as other countries (open red circles).

