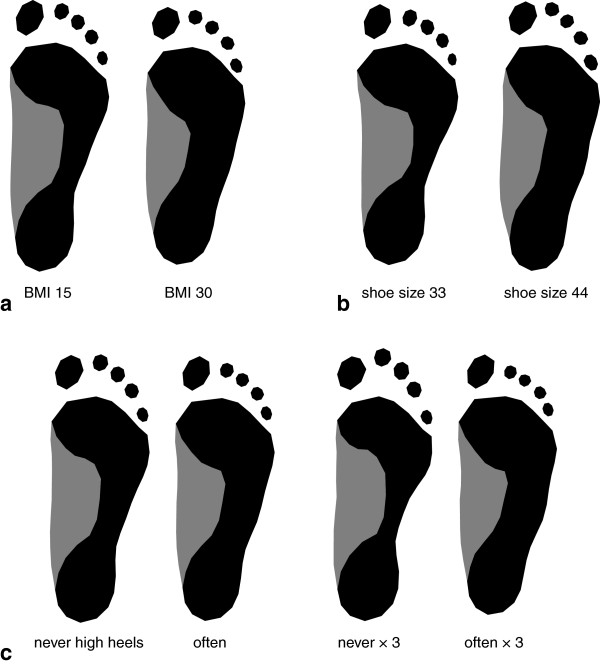
Figure 4.
Visualization of the effects of body mass index (BMI), shoe size, and the frequency of wearing high heels on footprint shape, estimated via linear regressions of shape on the corresponding factor. The displayed footprints are extrapolations of the actually occurring range of variability in order to effectively visualize the patterns of shape difference. (a) Expected footprint shapes for BMI 15 and BMI 30. (b) Expected footprint shapes for shoe size 33 and shoe size 44. (c) Average footprint shape for women never wearing high heels and for women often wearing high heels, together with footprint shapes derived from a threefold extrapolation of these effects.

