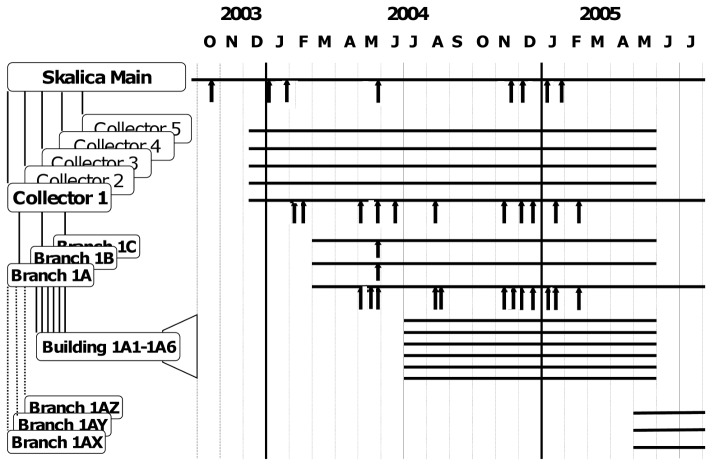
Figure 1. Collection of sewage samples in Skalica 2003–2005.
Panel at left shows schematic representation of relevant parts of sewer network in Skalica. The labels and the relation between the sewage collection sites are described in more detail in Results Grab samples from indicated sewers were collected through months covered by horizontal bars (panel at right). Arrows indicate dates of collection of specimens revealing one or more strains of type 2 VDPV in cell culture. See Table 1 for additional details.

