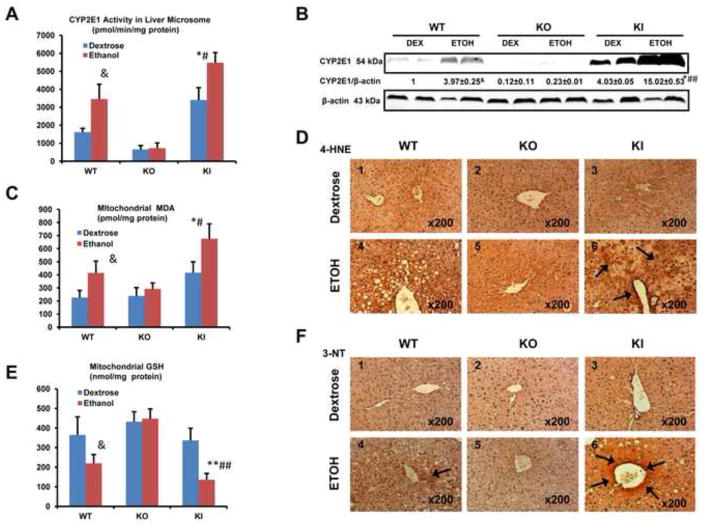
Fig. 2. CYP2E1 Levels and Oxidative Stress After Chronic Ethanol Feeding.
(A) CYP2E1 catalytic activity assayed with para-nitrophenol. (B) CYP2E1 protein levels. (C) MDA level in mitochondria. (D) Immunohistochemical staining for 4-HNE in liver. Panel D6 shows strong 4-HNE positive staining (arrows, IHC×200). Other panels show little or no obvious positive staining. (E) GSH level in mitochondria. (F) Immunohistochemical staining for 3-NT in liver. Panel D6 show strong 3-NT positive staining (arrows, IHC×200). Panel D4 show weak 3-NT positive staining (arrow, IHC×200). Other panels show no obvious positive staining * p<0.05, ** p<0.01 compared to the CYP2E1 KI groups fed dextrose. # p<0.05, ## p<0.01 compared to CYP2E1 KO or WT groups fed ethanol or dextrose. & p<0.05 compared to WT group fed dextrose.

