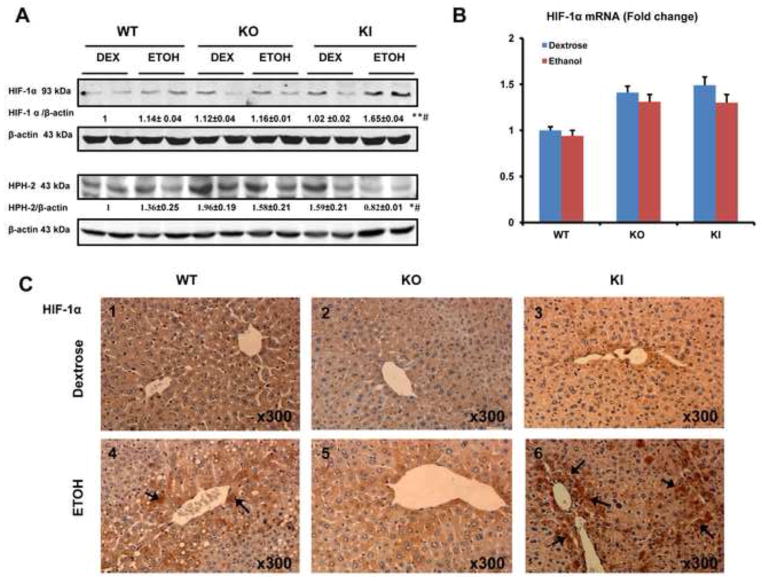
Fig. 3. Levels of HIF-1α and HPH-2 protein After Chronic Ethanol Feeding.
(A) Nuclear protein levels of HIF-1α and HPH-2. (B) HIF-1α mRNA level. Note no significant difference between all groups. (C) Immunohistochemical staining for HIF-1α in the liver. Panel C6 shows strong HIF-1a staining in the KI mice (+++) fed with ethanol (arrows, Fig. 3C), moderate HIF-1a staining in the WT mice (++)(Fig. 3C4, arrows, IHC×300) and weak or no positive staining in KO mice (Fig. 3C5, IHC×300) fed with ethanol. No obvious positive staining was observed in the dextrose-fed mice (−) (Fig. 3C1,3C2,3C3). * p<0.05, ** p< 0.01 compared to the CYP2E1 KI groups fed dextrose. # p< 0.05 compared to CYP2E1 KO or WT groups fed ethanol or dextrose.

