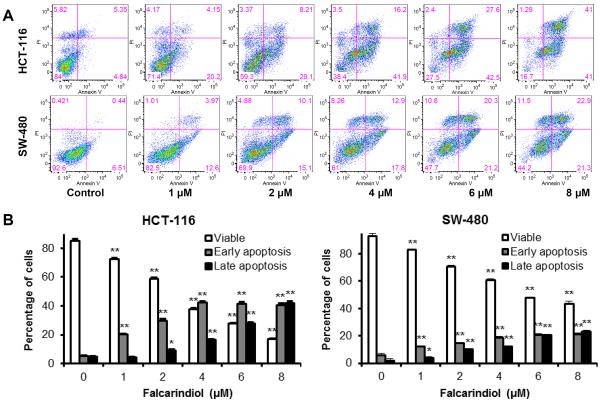
Fig. 5.
Apoptotic analysis of HCT-116 and SW-480 cells treated with falcarindiol. HCT-116 and SW-480 cells were treated with 1–8 μM of falcarindiol for 48 h, then stained with annexin V/propidium iodide (PI) before the extent of apoptosis was determined by flow cytometry. (A). Representative scatter plots of PI (y-axis) versus annexin V (x-axis). (B). Percentage of viable early apoptotic and late apoptotic cells. Data are presented as the mean ± standard error of triplicate experiments. *p < 0.05, ** p < 0.01 vs. control.

