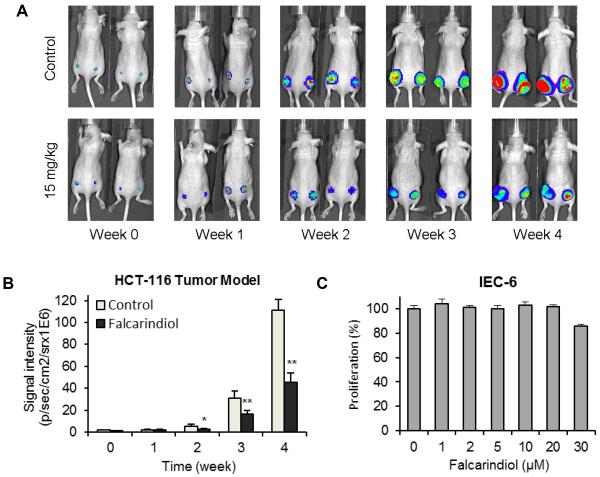
Fig. 6.
In vivo antitumor observation using a xenograft model and safety evaluation of falcarindiol. (A) Firefly luciferase-tagged HCT-116 cells were injected into both flanks of athymic mice subcutaneously (n = 10/group), and the tumor sizes after treatment with solvent control or 15 mg/kg/day of falcarindiol were measured on a weekly basis by xenogen bioluminescence imaging. Representative xenogen imaging results are shown. (B) Quantitative analysis of xenogen bioluminescence imaging. Average tumor sizes at the indicated time points are represented with imaging signal intensities (in photons/second/cm2/steradian) as mean ± standard error. *p < 0.05, **p < 0.01 vs. control. (C) Safety evaluation of falcarindiol on normal intestinal cells. The IEC-6 rat small intestine epithelial cells were treated with 1–30 μM of falcarindiol for 48 h, and cell proliferation was determined.

