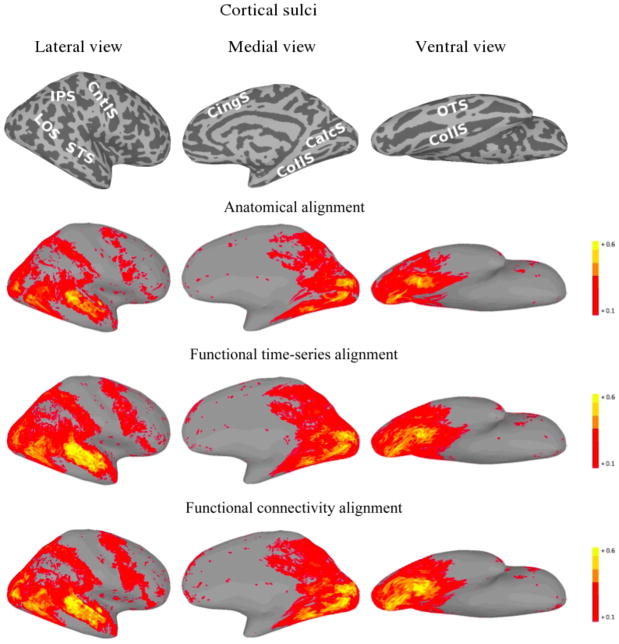
Figure 3.
Right hemisphere plots of average inter-subject time-series correlation for the second half of the movie under various alignments. For the function-based alignments, the first half of the movie was used as the training set. The top images show the sulcal anatomy on the inflated cortical surfaces (IPS—intraparietal sulcus; LOS—lateral occipital sulcus; STS—superior temporal sulcus; CntlS—central sulcus; CingS—cingulate sulcus; CalcS— calcarine sulcus; CollS—collateral sulcus; OTS—occipitotemporal sulcus).

