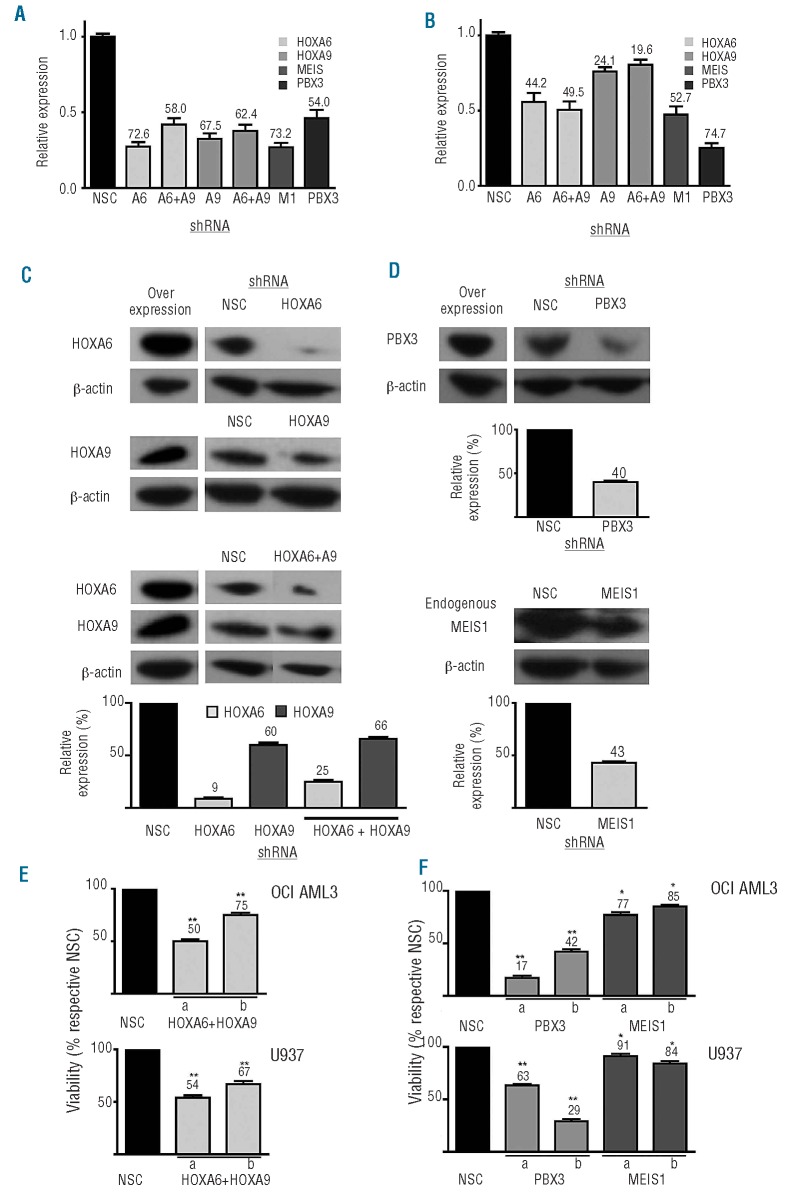
Figure 3.
Histograms depicting expression of HOXA6, HOXA9, PBX3 and MEIS1 in (A) OCI-AML3 and (B) U937 cell lines following target gene knockdown, compared to non-silenced controls (NSC). Percentage knockdown values at 72 h of either single genes or combinations as stated are labeled. Mean and standard deviation of three experiments are shown where relative expression was calculated using the 2−ΔΔCT method with 18S rRNA values as the calibrator. Western blot analysis shows reduced protein levels of overexpressed HOXA/PBX3 constructs or MEIS1 following incubation with specific shRNA for 48 h in 293FT or U937 cells. Representative data from two or three shRNA sequences per target are shown normalized using β-actin as a loading control and relative to NSC levels (C, D). Reduced viability of (E) HOXA6+HOXA9, PBX3 or (F) MEIS1 knockdown cells (two constructs per gene target a & b) expressed as percentages of respective NSC, measured by trypan blue exclusion with cell counting 24 h post-transfection. Data are representative of n≥4 with mean and standard deviation plotted, P≤ 0.01/0.001 are denoted by */**, respectively.

