Figure 1.
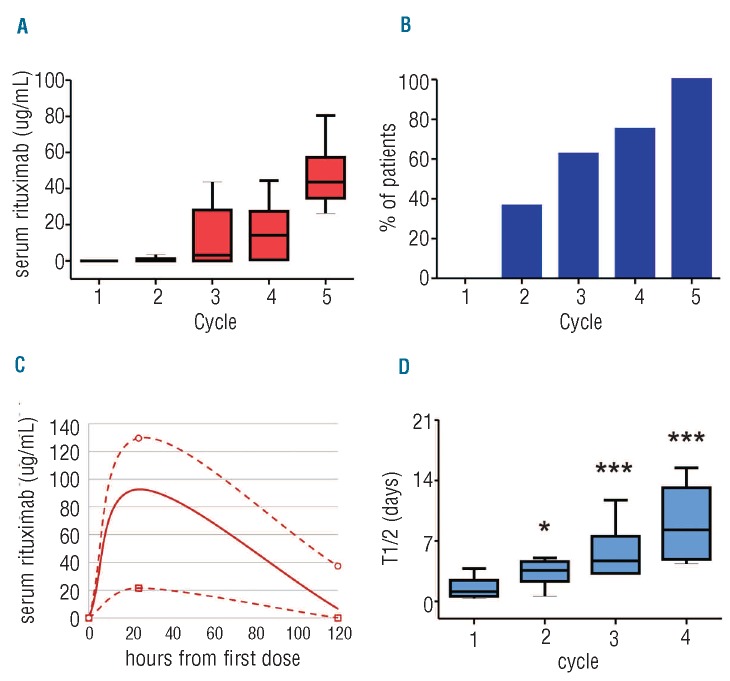
Rituximab pharmacokinetics in CLL. (A) Rituximab was administered every 4 weeks in combination with fludarabine. Rituximab trough levels during cycles 1–5 are depicted on Whisker plots (P<0.0001 by ANOVA). (B) Percentage of patients with detectable trough levels at the end of cycles 1–5 (P=0.0019 for time effect). (C) Minimum (open squares), median (solid line), and maximum (open circles) rituximab serum levels measured 24 and 120 hours after the first dose. Lines indicate an estimate of serum levels at time points in between actual measurements. (D) Median serum rituximab half-life during cycles 1–4. P values by t-test for comparison of the respective cycle to cycle 1 are *P<0.01 and ***P<0.0001.

