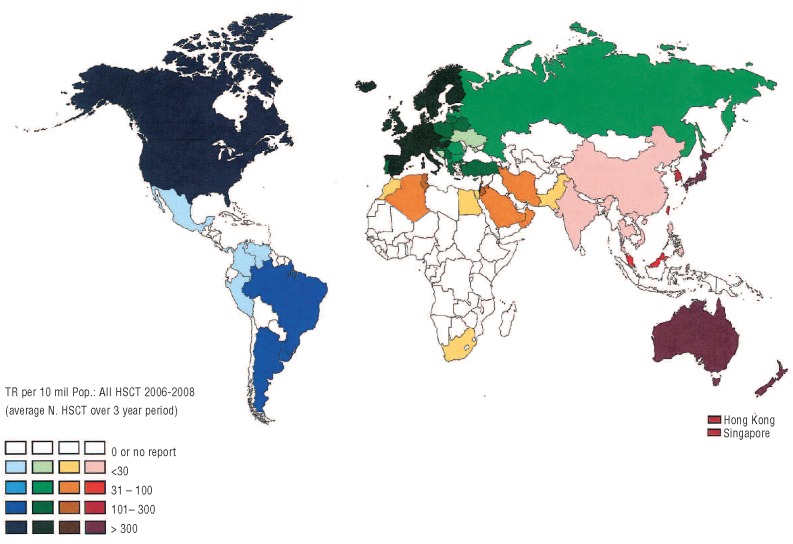
Figure 1.
Transplant rates for the total number of HSCT in participating countries by WHO regional offices area for the years 2006–2008. Regions are colored by WHO regional offices area code (see text). Shades of colors reflect transplant rates (numbers of HSCT, allogeneic and autologous combined, by 10 million inhabitants).

