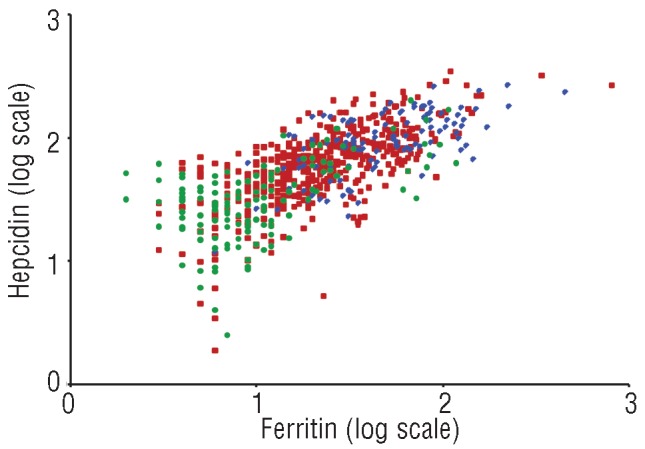
Figure 1.

Scatter plot of log10 hepcidin (ng/mL) by log10 ferritin (ng/mL) demonstrates the correlation between the two plasma assays and the clustering of baseline female values in the upper right quadrant of the graph: ( ) Female baseline visits ( ) Female other visits ( ) Male visits.
