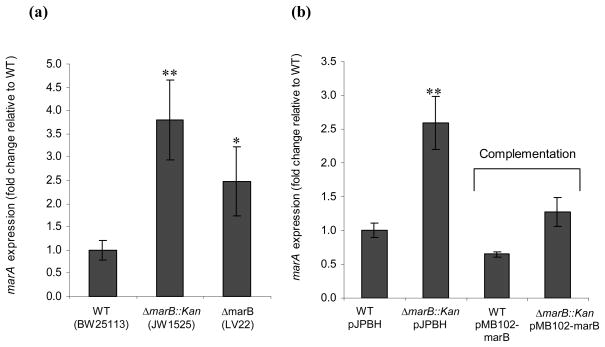
Fig. 1.
marA gene expression (a) in wild type and ΔmarB mutant strains and (b) when complemented by wild type marB. Shown are relative amounts of marA gene transcript in wild type (WT) and ΔmarB::kan mutant hosts carrying no plasmid (a) or carrying either complementing plasmid pMB102-marB or control vector pJPBH (b). Fold 1 means no change in marA expression in a mutant compared to the level for the parental strain. The results in each chart are normalized to the first sample and are presented as the average +/− the standard error of the mean (Fig. 1a, n=5; Fig. 1b, n=3). Statistically significant differences for a mutant compared to the level for the parental strain are shown as * (P < 0.05) or ** (P <0.01).

