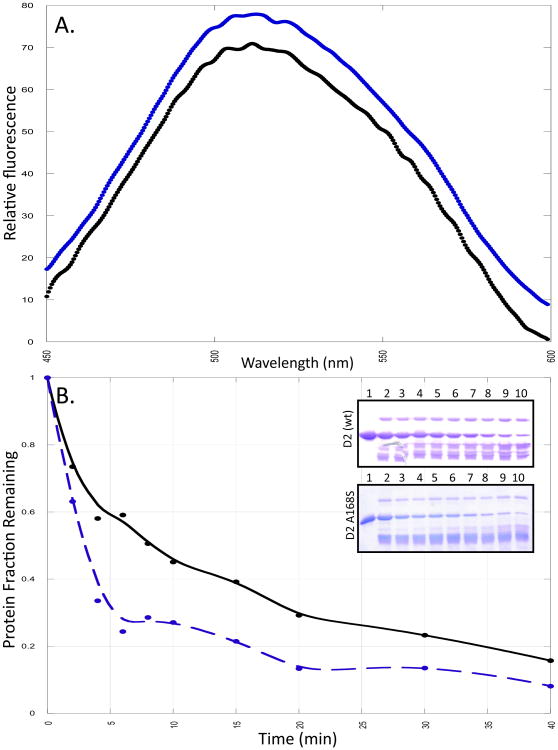
Fig. 2.
Panel A represents the ANS spectra in the presence of the wild type (black) and the A168S mutant of the D2 domain (blue). The concentration of ANS is 150 μM. Panel B shows the densitometric plot of the limited-trypsin digestion of wild type (black) and the A168S (blue) mutant of D2 domain. Panel B insert shows the 15% SDS PAGE of the limited-trypsin digestion of the wild type and A168S mutant of the D2 domain after 0, 2, 4, 6, 8, 10, 15, 20, 30 and 40 minutes of incubation of the protein domain with trypsin.

