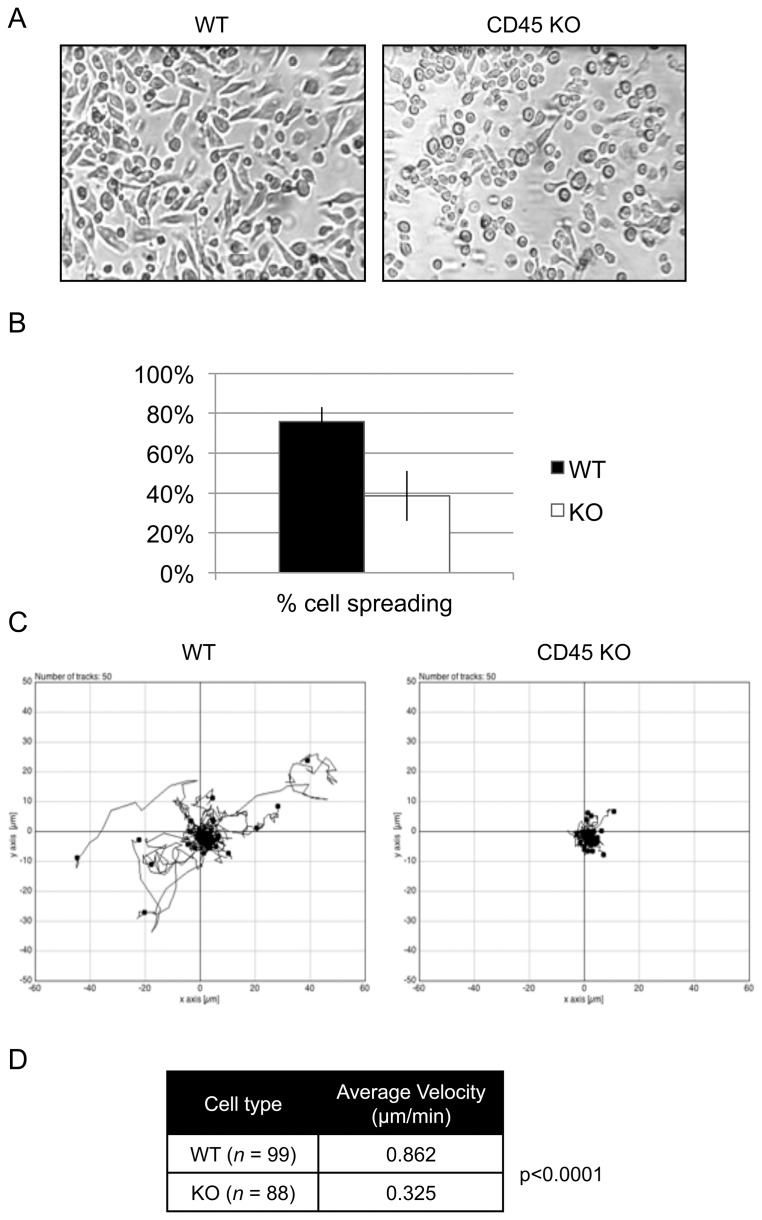
Figure 1. CD45 KO BMDM exhibit decreased cell spreading and motility compared to WT BMDM.
(A) Morphology of day 7 WT and CD45 KO BMDM in culture. (B) Quantification of spread cells versus non-spread cells from three independent cultures of WT (black) and CD45 KO (white) BMDM as described in the materials and methods. (C) Cell tracking of fifty cells each of WT and CD45 KO BMDM on tissue-culture-treated wells for 30 minutes. (D) The average velocity of WT and CD45 KO BMDM. This data is representative of three independent experiments.

