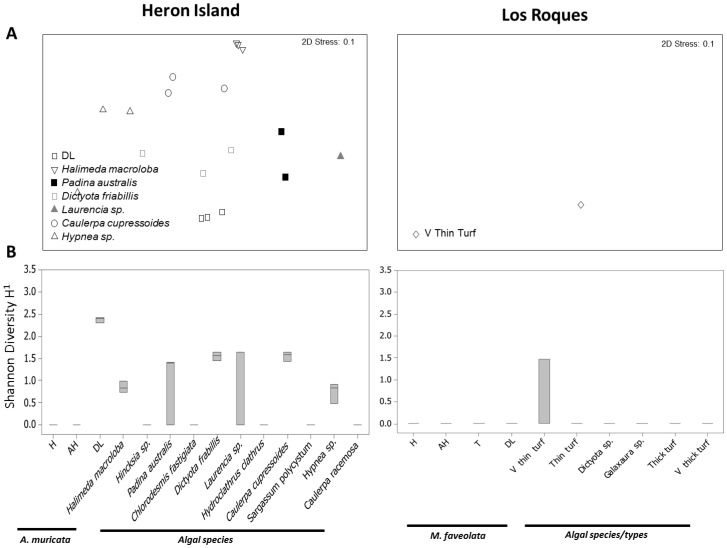
Figure 4. Ciliate 18S rRNA gene communities associated with various coral and algal samples at Heron Island and Los Roques.
A) Multidimensional scaling (MDS) plot showing changes in ciliate communities. B) Shannon-Wiener Diversity Index. The middle bars are medians, boxes show quartiles, whiskers show 95% CI of data. Abbreviations as in Fig. 1.

