
Figure 6. Heatmap summarizing the relative density of dominant DGGE bands according to BioNumerics for 18S rRNA gene ciliate profiles of coral (M. faveolata) and algal samples collected in Los Roques.
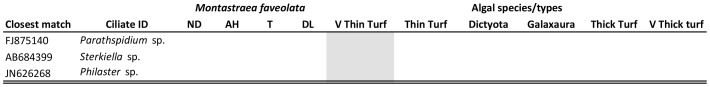
All replicates (N = 3 per sample type) have been included in this table. Abbreviations as in Fig. 1 and key as in Fig. 2.