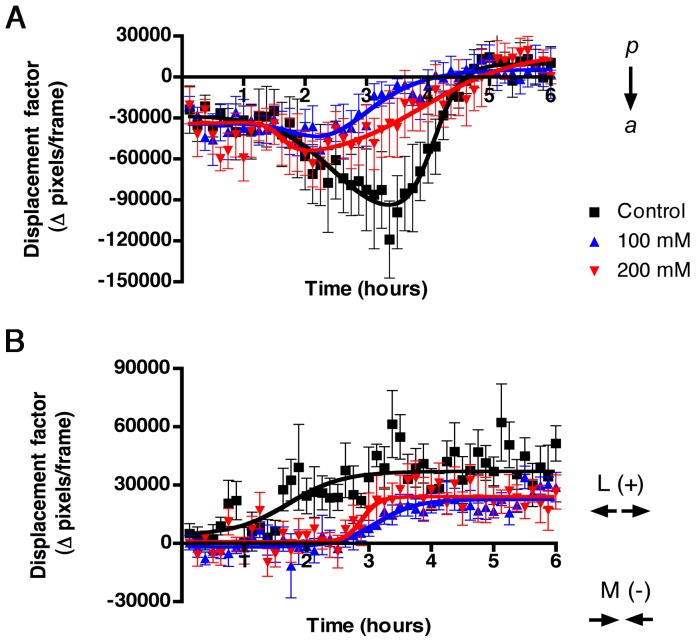
Figure 3. Optical Flow averaged cell movements are different in EtOH treated vs. control groups.
OF analysis were averaged and represented over time as net displacement reflecting: A) Posterior-Anterior cell movements over time (negative numbers in the Y-axis represent anterior cell movements) and B) Horizontal cell movements (medial and lateral) over time (negative numbers in the Y-axis represent movements towards the middle of the field). Lines show the sum of two sigmoid functions. n = 5 per group. a = anterior, p = posterior, L = lateral movements M = medial movements. Error bars = SEM.

