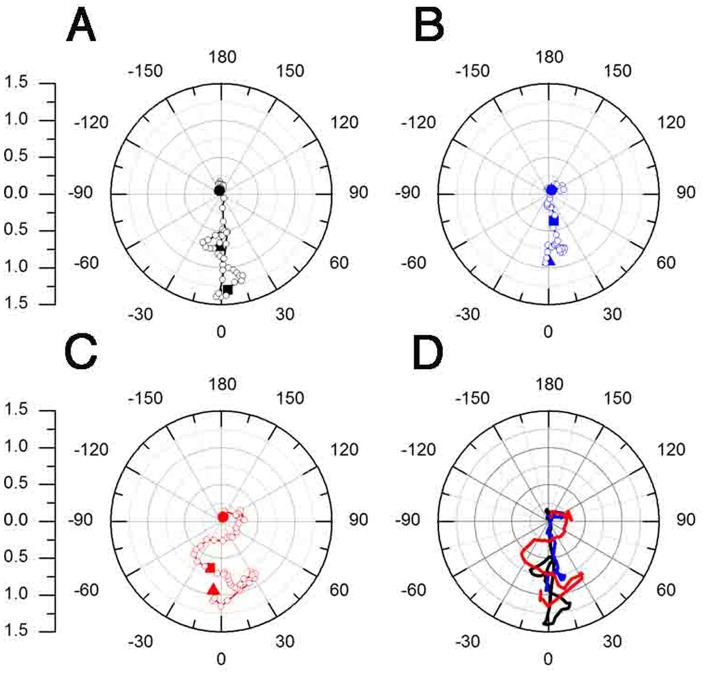
Figure 4. Ethanol alters CNCC net movement and directionality.
A–D) Polar graphs of the angle (q) and magnitude (r) of the mean motion vector over time. A) Control showing net anterior movement of CNCC. B) 100 mM EtOH showing reduced magnitude but net anterior movement. C) 200 mM EtOH showing both reduced magnitude and loss of directionality. D) Summary of A–C. The triangles indicate migration at t = 0, squares t = 3 h, and circles at t = 6 h. Open circles represent individual data points during the sequence. The scale on left shows the magnitude (r) values.

