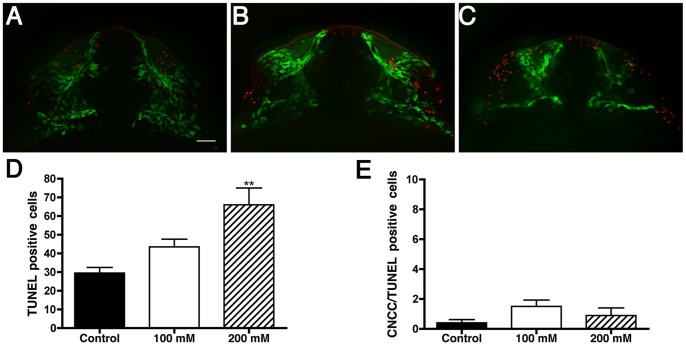
Figure 8. Ethanol increases non-specific cell death.
Fluorescent images showing cell death (red) and CNCC (green) in A) Control, B) 100 mM EtOH and C) 200 mM EtOH treated sox10:EGFP 24 hpf embryos. D) Variance analysis reveals a significant increase in the number TUNEL positive cells (p<0.0007; n = 10 per treatment) throughout the craniofacial area. E) The number of CNCC positive for both EGFP and TUNEL are: control = 0.4 cells, 100 mM = 1.5 cells, and 200 mM = 0.9 cells. Error bars = SEM. Frontal views: dorsal to the top. Scale bar = 20 µm.

