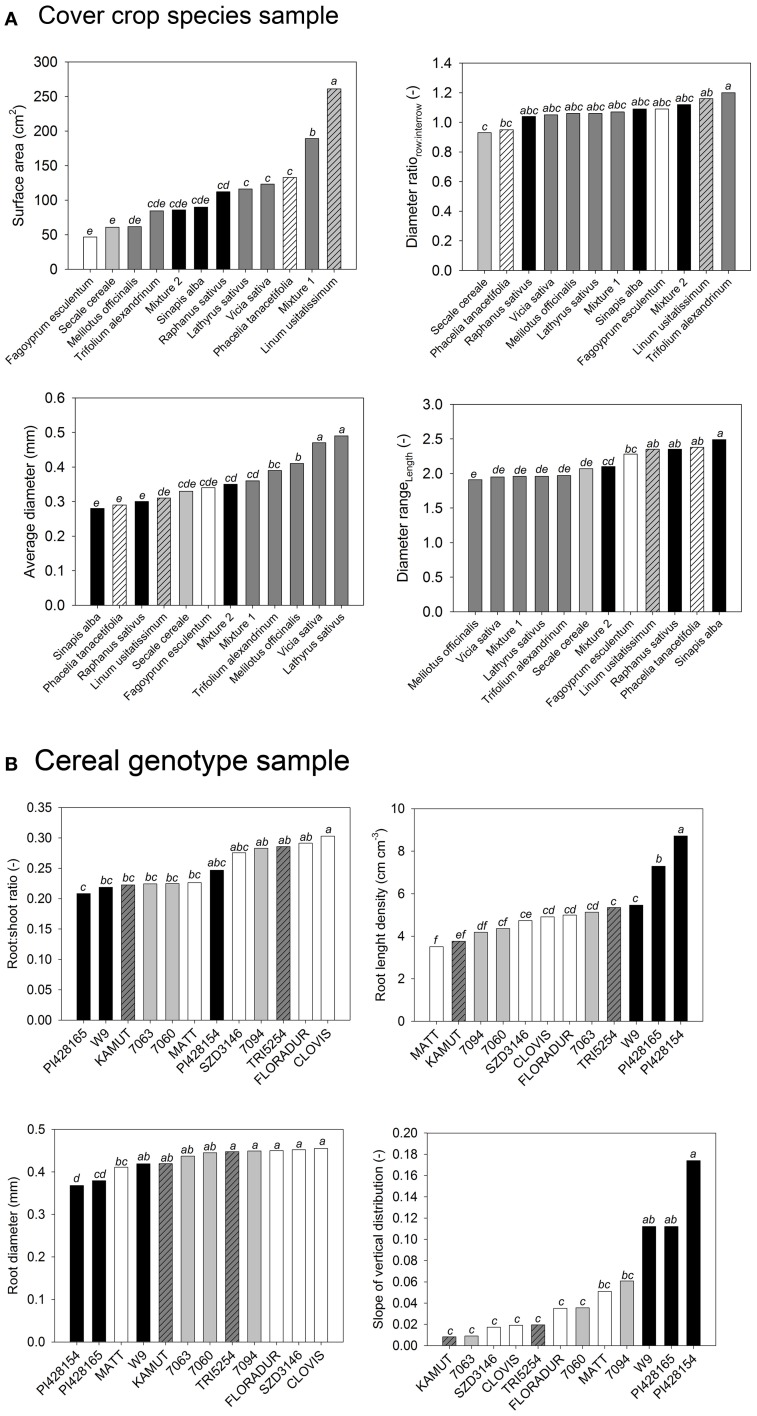
Figure 2.
Analysis of variance of selected root morphological traits from (A) the cover crop and (B) the cereal genotype sample. Change in neighboring bars of species order shows that single trait analysis leads to different conclusions for each trait. (Statistical comparison of means is indicated by lowercase letters. Species sharing a common letter are not significantly different from each other at p < 0.05).

