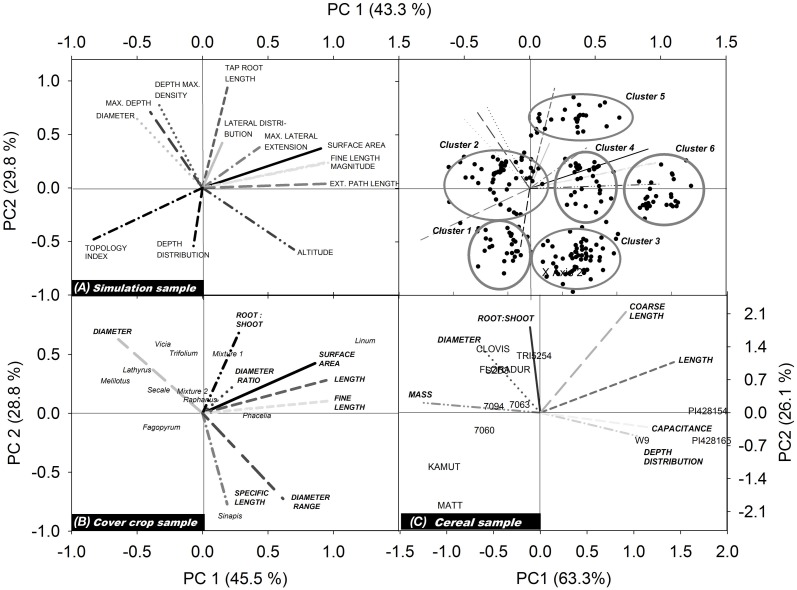
Figure 3.
Biplots showing trait vectors and location of the single objects from (A) the simulation sample, (B) the cover crop species sample, and (C) the cereal genotype sample. For better visualization of the simulation results, trait vectors and objects are shown in separate biplots (for explanation of root traits, cf. section Measured Root System Morphology).

