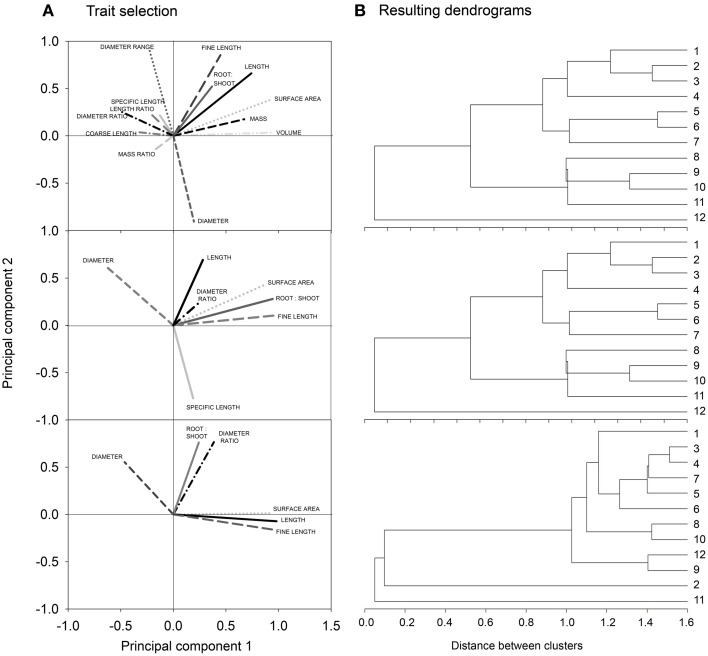
Figure A2.
Example for biplot inspection (A) to ensure congruency of subsequent grouping via cluster analysis (B). Biplots are used to visualize the mutual relation between different traits and to determine which traits are essential to conserve the overall variance in a multi-trait root system characterization (Data from species experiment, cf. Measured Root System Morphology; Root:shoot is root-to-shoot dry matter ratio; mass, length and diameter ratio are indicators of lateral distribution calculated by dividing the respective parameter measured in and between plant rows).

