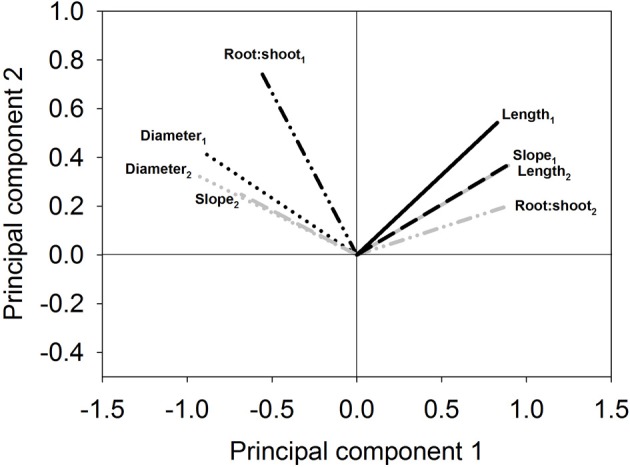
Figure A3.

Example of biplot to check expectable repeatability of groups in subsequent clustering. Measured morphological traits of the same genotypes at the same site over 2 years. (Subscripts indicate first and second year sampling; data from Triticum experiment; slope is calculated from the root length density decrease over soil depth).
