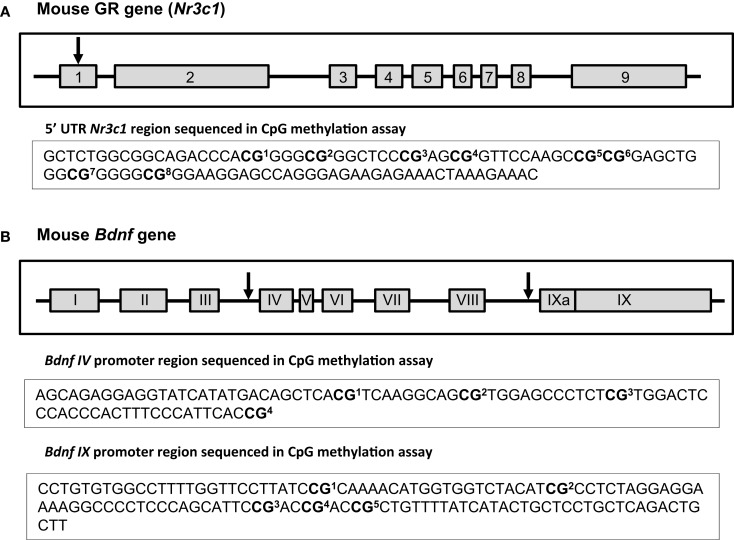
Figure 4.
Schematic of Nr3c1 and Bdnf genes. Exons are depicted as gray boxes and the introns as lines. Numbers of Nr3c1 exons (A) are indicated in Arabic numerals while numbers of Bdnf exons (B) are indicated in Roman numerals to conform to standard nomenclature. The arrows show the approximate location of the examined sites within those genes. The sequences under each scheme show the exact CpG sites that were analyzed in 5′UTR region of Nr3c1 (A) and in Bdnf promoter regions IV and IX (B) using bisulfite-pyrosequencing method [the schemes of Nr3c1 and Bdnf genes were adapted from (67) and (68) respectively].

