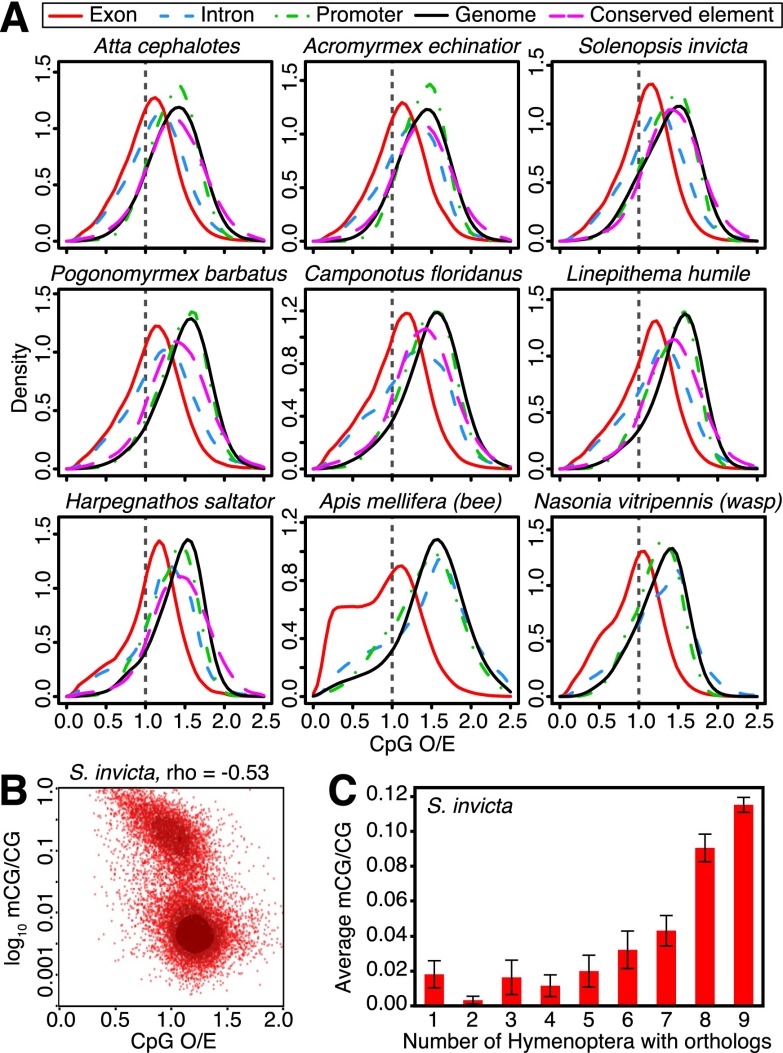
Figure 3.
DNA methylation profiles in ant genomes. (A) Normalized CpG content (CpG O/E) of different genomic elements, including exons, introns, and promoter regions (1.5 kb upstream of coding sequence start sites) for protein-coding genes, nongenic conserved elements, and genome-wide background (1-kb fragments). Exons show the strongest evidence of CpG depletion in ants, indicating that they are the most highly methylated regions of the genome in all taxa (confirmed by Bisulfite-seq; below). Introns also show slight depletion of CpGs in ants, suggesting some intron methylation. (B) Scatterplot of log10(mCG/CG) methylation levels estimated by Bisulfite-seq versus CpG O/E for coding sequences in S. invicta reveals a bimodal distribution of gene body methylation. (C) Average methylation levels (mCG/CG) for protein-coding genes in S. invicta males, grouped according to the number of taxa in Hymenoptera with orthologs for each gene; indicating that conserved genes tend to be highly methylated. Error bars indicate 95% confidence intervals for the mean.

