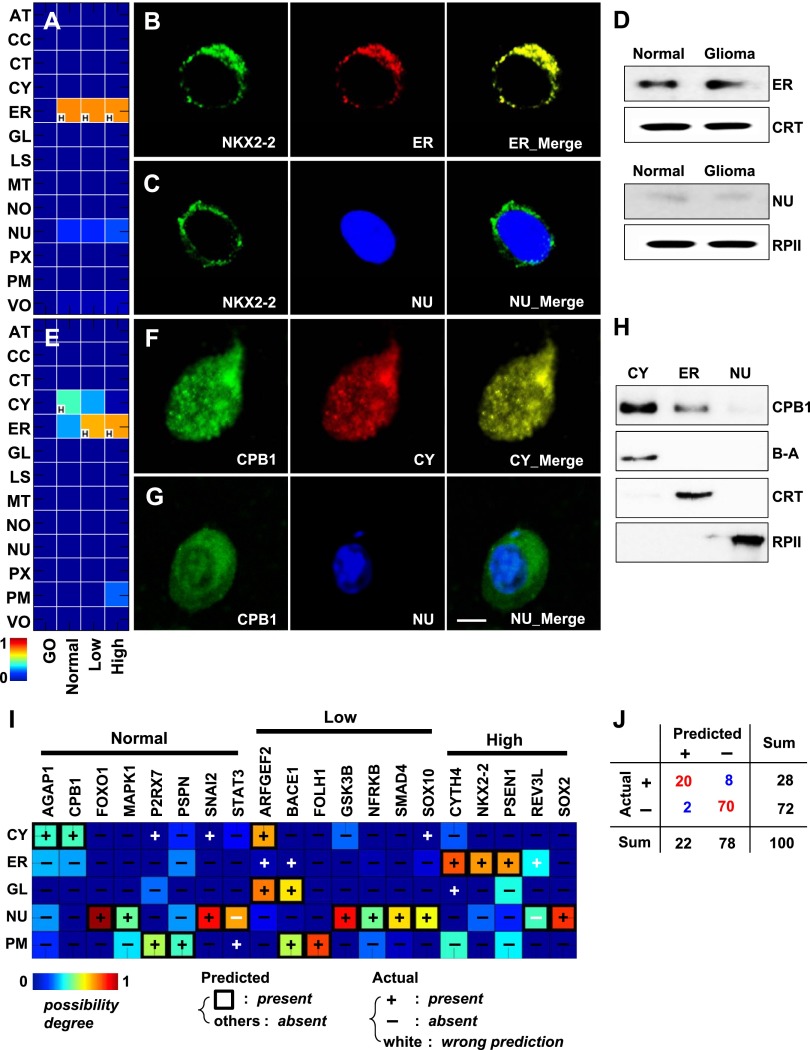
Figure 3.
Novel protein locations in normal brain and glioma and predictive performance. (A) Conditional location map for NKX2-2. A possibility degree between 0 and 1 (blue to red gradient) was assigned to each of 13 subcellular locations (rows) across three conditions: normal brain, low- and high-grade gliomas (columns). The letter “H” in the lower left-hand corner of the panels marks the location with the highest degree of possibility among the 13 locations considered for each condition. (B) A series of three images of the same cell from normal brain tissue, showing anti-NKX2-2 (left, green), the ER (middle, red), or a merged image (right). The yellow color in the right panel indicates high overlap between NKX2-2 and the ER. (C) A second series showing anti-NKX2-2 (left, green), a nuclear marker (middle, blue), and a merged image (right). (D) Results of cellular subfractionation and Western blotting to determine the location of NKX2-2 in normal brain and primary glioma cells. (E) Conditional location map for CPB1. (F,G) Cells stained with anti-CPB1 (green) and a cytosolic (F, red) or nuclear (G, blue) marker in normal brain tissue. Scale bar, 5 μm. (H) Results of cellular subfractionation and Western blotting to determine the location of CPB1 using normal brain primary cells. (I) Heat map of immunochemistry validation results. Twenty proteins (columns) were interrogated at up to five locations (rows) using two-dimensional imaging. Predictions overlaid with experimental observations (+ present or – absent). The color of the heat map indicates the predicted score, here, the degree of possibility. Symbols are colored black if predictions are correct; otherwise, they are white. (J) Validation statistics from I summarized in tabular form. See Supplemental Figures S7 and S8 for antibody specificity tests for the locations and the proteins used in this study. (β-A) beta-actin for a cytosol marker, (CRT) calreticulin for endoplasmic reticulum, (RPII) RNA polymerase II for nucleus.

