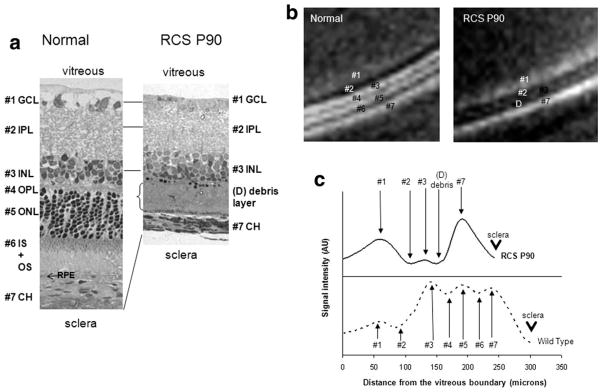
Figure 3.

(a) Histology, (b) Mn-enhanced MRI, (c) signal intensity profiles from a normal and a P90 RCS retina. The layer assignments of the normal rat retina are: 1. ganglion cell layer (GCL), 2. inner plexiform layer (IPL), 3. inner nuclear layer (INL), 4. outer plexiform layer (OPL), 5. outer nuclear layer (ONL), 6. inner and outer photoreceptor segment layer (IS+OS), and 7. choroidal vascular layer (CH). RPE denotes retinal pigment epithelium. In the P90 RCS retina, bands #4–6 appeared missing and band #3 showed reduced signal intensity, whereas band #1 was slightly more enhanced, compared to the corresponding bands in the normal retina. The corresponding histological slide of the P90 RCS retina showed a debris band in place of bands #4–6 in the normal retina. Letter D indicates the debris layer. The arrowhead in c indicates the sclera.
