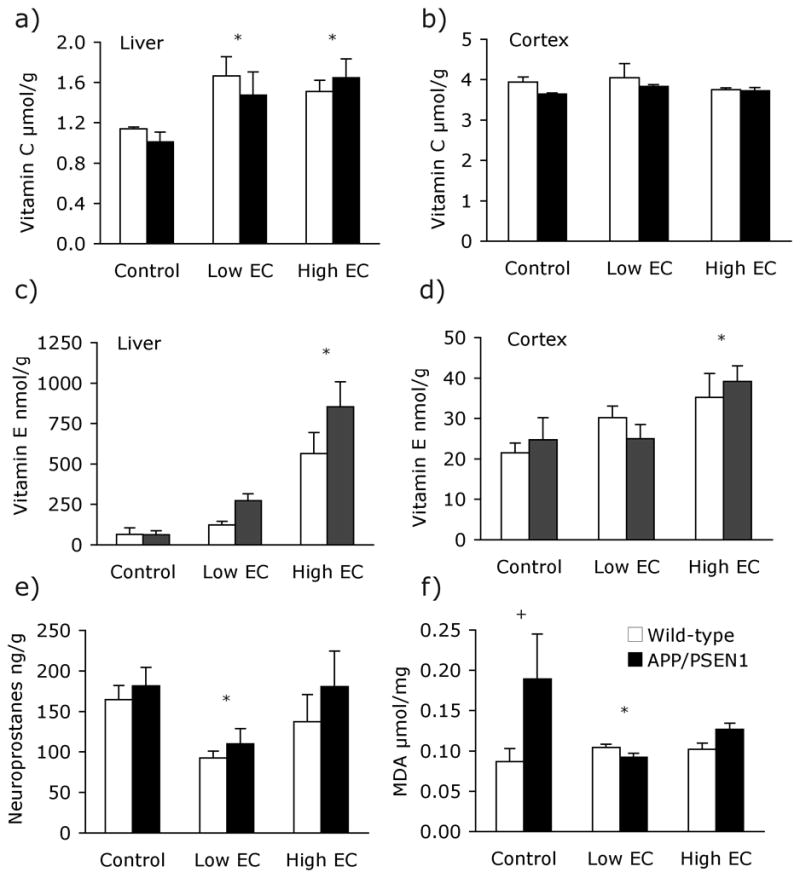
Figure 5. Neurochemical data – Experiment 2.

Vitamins C and E were measured in the cortex and liver of mice following treatment and behavioral testing. (a) Both vitamin treatents led to increases in vitamin C in the liver (P<.01). (b) Vitamin C levels in the cortex were unaffected by vitamin treatments (P>.20). The High EC treatment led to elevated vitamin E levels (c) in the liver (P<.001) (d) and cortex (P<.05). Liver and brain vitamin E levels in mice fed the Low EC treatment did not differ from those of control-fed mice (Ps>.91). (e) F4-Neuroprostane levels did not differ significantly between APP/PSEN1 (black bars) and wild-type mice (white bars) in Experiment 2; however, supplementation with the Low EC treatment led to a significant decrease in F4-neuroprostanes in the cortex (P<.05). Neuroprostane measurements in the brains of mice supplemented with High EC treatment did not differ from control-treated animals (P=.82). (f) Malondialdehyde levels in the cortex of APP/PSEN1 on the control diet were elevated relative to control-fed wild-type mice (P<.05). Genotype differences were not seen in either of the supplemented groups however Low EC-fed APP/PSEN1 mice had lower malondialdehyde levels than control-fed transgenic animals. * P <0.05 Low EC mice different from control-treated mice and + P <.05 APP/PSEN1 mice different from wild-type mice.
