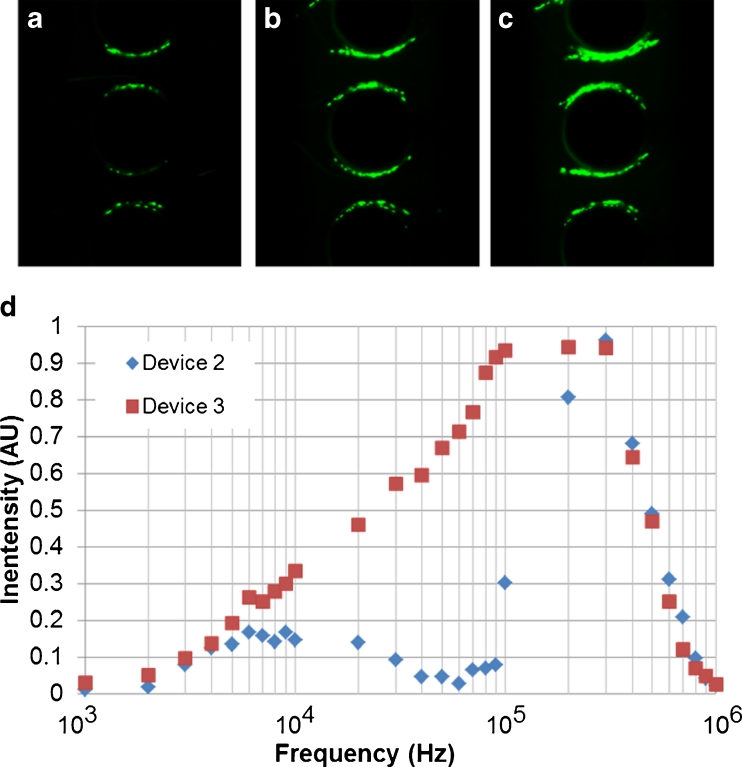
Fig. 3.
Observed DEP trapping of E. coli in the OπDEP devices for an applied AC signal at 400Vp-p and a flow rate of 400 μL/h. Trapping images are shown for Device 2; (a) 10 kHz signal; (b) 100 kHz signal; (c) 300 kHz signal; (d) quantized light intensity in the trapping region as a function of frequency (n = 10)

