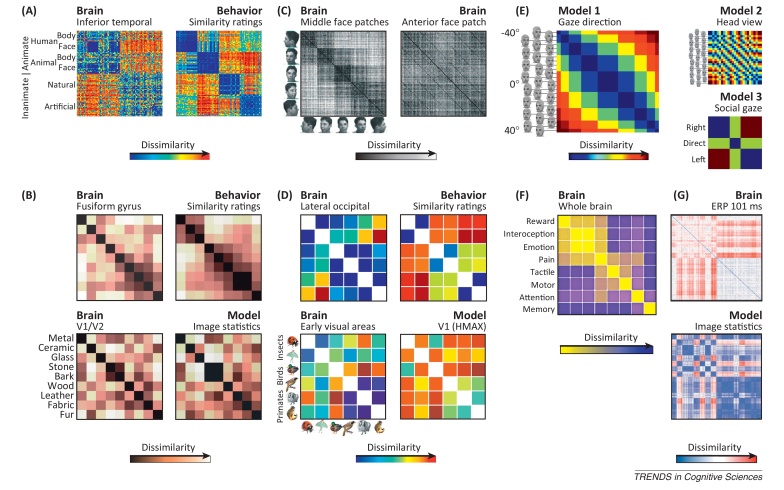
Figure I.
Representational dissimilarity matrices in recent studies. (A) RDM from fMRI patterns in human IT and RDM based on human dissimilarity judgments. Reproduced, with permission, from [54]. (B) RDMs from fMRI responses to natural visual textures from a model of low-level image statistics and from human similarity ratings. Reproduced, with permission, from [35]. (C) RDMs from neuronal recordings for monkey middle face patches (middle lateral and middle fundus, 121 neurons) and anterior face patch (anterior medial, 158 neurons). The stimuli are faces of different identities and views. One photograph per view labels a set of rows and columns for different identities in that view. Reproduced, with permission, from [67]. (D) RDMs from fMRI responses to images of animals from six species in three biological categories and from a computational model of V1 and subject judgments of biological similarity. Reproduced, with permission, from [53]. (E) RDMs for three different models of representation of faces and eye positions: model 1, by gaze direction; model 2, by head view (ignoring eyes); and model 3, by gaze categories relative to the observer (direct/eye contact, left, right). Reproduced, with permission, from [80]. (F) Whole-brain activity pattern dissimilarities between different functional states. Global patterns were estimated meta-analytically. Reproduced, with permission, from [113]. (G) RDMs based on spatial patterns of human event-related-potential amplitudes evoked by natural Images 101 ms after stimulus onset (top) and a model based on parameters of a Weibull fit to the spatially pooled distribution of local contrast measurements (bottom). Reproduced, with permission, from [37].

