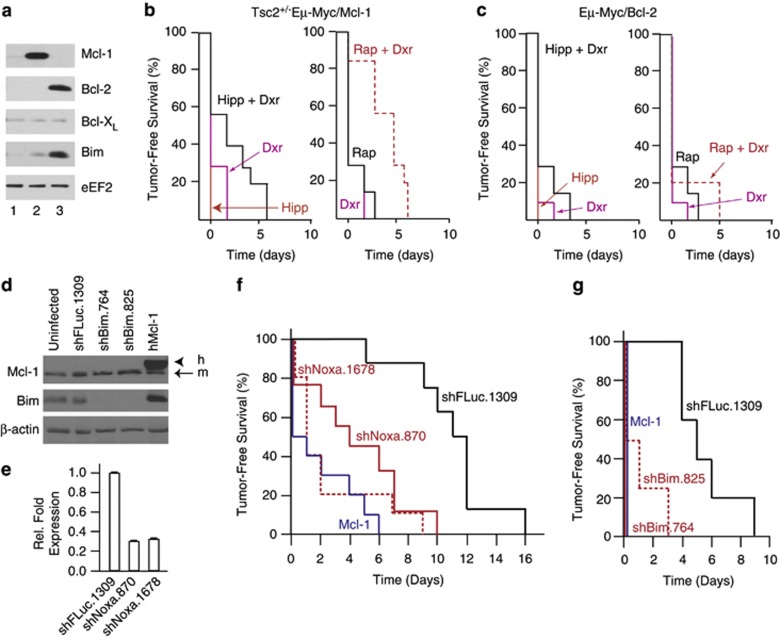
Figure 3.
Components of the intrinsic cell death pathway are genetic modifiers of Hipp-mediated chemosensitivity. (a) Western blot analysis of Mcl-1, Bcl-2, Bcl-XL, and Bim in Tsc2+/−Eμ-Myc tumors. Extracts were derived from: Tsc2+/−Eμ-Myc (lane 1); Tsc2+/−Eμ-Myc/Mcl-1 (lane 2); and Eμ-Myc/Bcl-2 (lane 3) cells. (b) Kaplan–Meier curve demonstrating response of Tsc2+/−Eμ-Myc/Mcl-1 tumor-bearing mice to Hipp, Dxr, Rap or a combination of treatments. n=10 mice per cohort, P=0.157 for Hipp+Dxr versus Dxr. (c) Kaplan–Meier curve demonstrating response of Eμ-Myc/Bcl-2 tumor-bearing mice to Hipp, Dxr, Rap or a combination of treatments. n=10 mice per cohort, P=0.118 for Hipp+Dxr versus Dxr. (d) Western blot analysis of Tsc2+/–Eμ-Myc lymphomas expressing the indicated shRNAs or Mcl-1 cDNA (lane 5) and probed with antibodies to the proteins denoted to the left of the panels. h, human; m, mouse. (e) Quantitation of Noxa RNA levels by RT-qPCR from total RNA isolated from Tsc2+/–Eμ-Myc lymphomas expressing the indicated shRNAs. The values were normalized to β-actin mRNA. (f) Kaplan–Meier curve demonstrating response of Tsc2+/−Eμ-Myc tumor-bearing mice expressing the indicated shRNAs, or overexpressing Mcl-1, to Hipp+Dxr combination treatment. n=8 (Tsc2+/–Eμ-Myc/shFLuc.1309), n=9 (Tsc2+/–Eμ-Myc/shNoxa.870), n=10 (Tsc2+/–Eμ-Myc/shNoxa.1678), n=10 (Tsc2+/–Eμ-Myc/Mcl-1); P<0.001 for Tsc2+/–Eμ-Myc/shFLuc.1309 compared to Tsc2+/–Eμ-Myc/shNoxa.870. (g) Kaplan–Meier curve demonstrating response of Tsc2+/−Eμ-Myc tumor-bearing mice expressing the indicated shRNAs or overexpressing Mcl-1 to Hipp+Dxr combination treatment. n=5 (Tsc2+/–Eμ-Myc/shFLuc.1309), n=4 (Tsc2+/–Eμ-Myc/shBim.764), n=4 (Tsc2+/–Eμ-Myc/shBim.825), n=5 (Tsc2+/–Eμ-Myc/Mcl-1); P<0.001 for (Tsc2+/–Eμ-Myc/shFLuc.1309 compared to Tsc2+/–Eμ-Myc/shBim.825). (Note that the shFluc.1309 cohort in this experiment was independently derived from the one present in panel 2F and shows a slightly shortened tumor-free survival period.).

