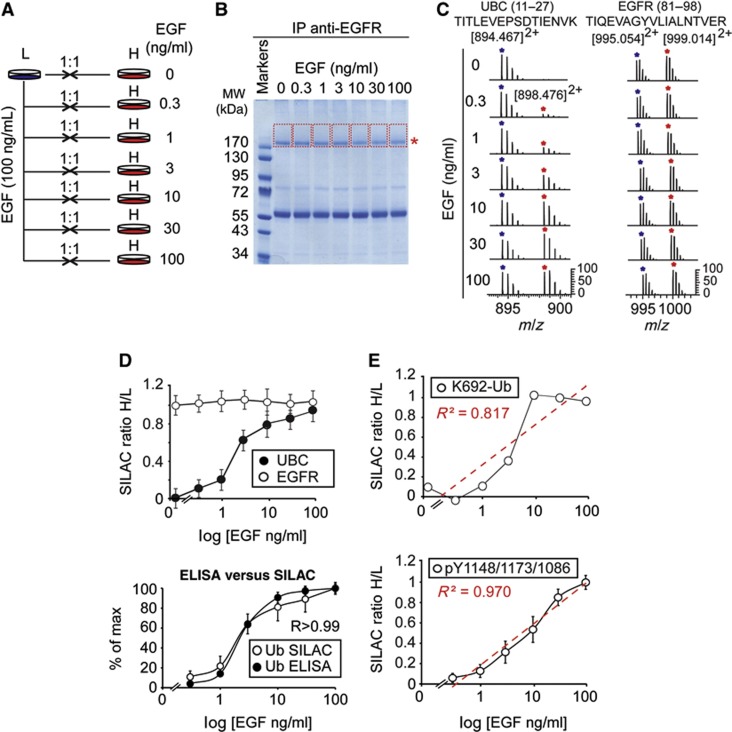
Figure 2.
SILAC-MS for quantitative analysis of ubiquitinated and phosphorylated EGFR. (A) Schematic representation of the SILAC-MS approach. HeLa cells were grown in SILAC-encoded ‘light’ or ‘heavy’ media (Supplementary Experimental Procedures). ‘Light’ (L) cells were stimulated with 100 ng/ml of EGF; ‘heavy’ (H) cells were treated independently with increasing concentrations of EGF, as indicated. Cells were then harvested and mixed (H/L) in 1:1 ratio for each pair. (B) Lysates from the seven H/L mixtures were subjected to anti-EGFR IP and SDS–PAGE. Lanes were cut (shown by red lines) starting from the position of the EGFR (asterisk), to cover potential differentially ubiquitinated forms. (C) Left, LTQ-FTICR mass spectra of Ub (UBC, peptide 11–27, left) and EGFR (peptide 81–98, right) from each H/L mixture (a more detailed representation is in Supplementary Figures 3B and C). (D) Threshold ubiquitination of EGFR, detected by MS. Top, high-accuracy quantification of total EGFR (87) and Ub (13) peptides; see Supplementary Table 1 for raw data. Bottom, comparison of EGFR-Ub data obtained with forward ELISA (Figure 1C) and SILAC-MS (from top panel). R, Pearson correlation coefficient. (E) Top, SILAC ratios of the EGFR ubiquitination site (K692-Ub) shown in Supplementary Figure 3G. Bottom, mean SILAC ratios of EGFR phosphorylation were calculated on the basis of the three pY sites shown in Supplementary Figures 3D–F. Note that, while mean pY increases linearly upon EGF stimulation (R2=0.97, square of correlation coefficient; see also Supplementary Figures 3D–F for the linear behaviour of single pY sites), the abundance of the EGFR-Ub peptide increases with a threshold behaviour, similarly to total Ub (panel D). SILAC ratios are calculated using MaxQuant (see Supplementary Figures 3H–K for more detailed pictures).

