Figure 3.
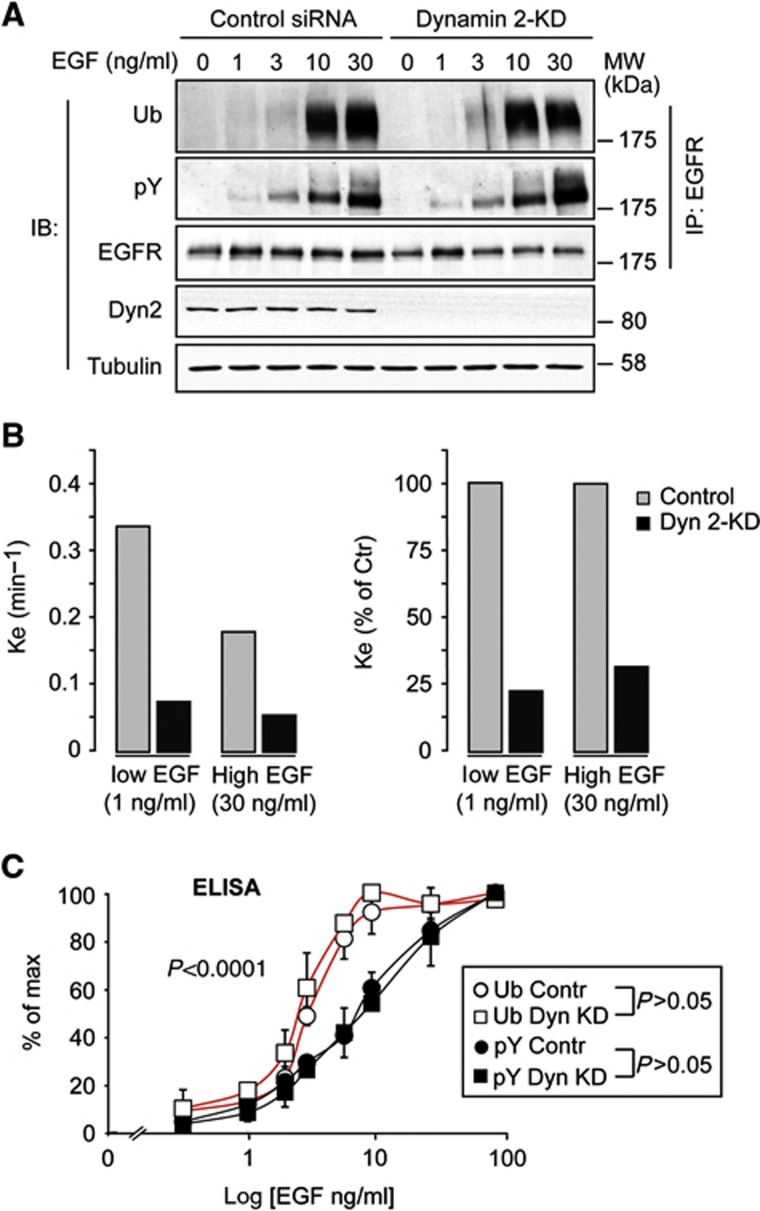
The threshold effect for EGFR ubiquitination occurs at the PM. (A) Top, HeLa cells were subjected to dynamin 2-KD and treated for 2 min with EGF at the indicated concentrations. IP and IB were as shown. (B) EGFR internalization kinetics in dynamin 2-KD cells was measured using 125I-EGF at low (1 ng/ml) or high (30 ng/ml) EGF concentrations. Results are expressed as the internalization rate constant (Ke, left panel) or as % of Ke in control cells (right panel), and are the mean of triplicate points (s.e.m.<8%). Dynamin 2-KD (Dyn 2-KD) severely impaired EGFR internalization both at low and high EGF concentrations, reducing rates to background levels. Similar background levels have previously been observed by us in clathrin-KD+filipin-treated HeLa cells, in which both CME and NCE are inhibited (Sigismund et al, 2005, 2008). These results confirm that both CME and NCE of the EGFR are dynamin 2 dependent. Comparable results were obtained with two different silencing oligos for dynamin 2 (data not shown). (C) Lysates of HeLa cells, control and dynamin 2-KD, stimulated with EGF for 2 min at the indicated concentrations were subjected to ELISA, forward approach (Supplementary Figure 2A), using anti-Ub (FK2) and anti-pY as detecting antibodies. Results are shown as a percentage of the maximal tyrosine phosphorylation or ubiquitination (% of max, see Materials and methods). Graph error bars indicate s.d. calculated on at least three independent experiments. All P-values were calculated using two-way ANOVA analysis. As shown the Ub curves were not significantly different between control and KD; the same was true for the pY curves. Conversely, the Ub curves were significantly different from the pY curves.
Source data for this figure is available on the online supplementary information page.

