Figure 4.
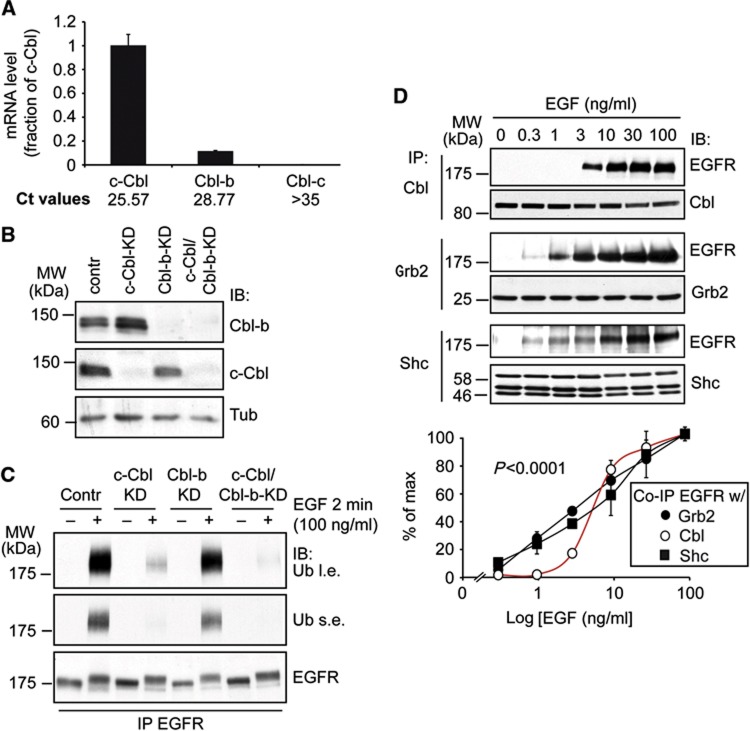
The EGFR–Cbl interaction is threshold controlled. (A) Q-PCR of c-Cbl, Cbl-b and Cbl-c in HeLa cells. Both Ct values (threshold cycles) and mRNA level of c-Cbl, Cbl-b and Cbl-c (normalized on 18S mRNA and expressed as fraction of c-Cbl mRNA) are reported. (B) HeLa cells were subjected to c-Cbl and Cbl-b-KD, alone or in combination (Contr, HeLa cells transfected with control oligo). IB was as shown (Tub, tubulin; loading control). (C) HeLa cells, transfected with the indicated oligos as in B, were stimulated with EGF as shown. Lysates were subjected to IP and IB as shown. For the Ub blots: l.e., long exposure; s.e., short exposure. Note that two different oligos targeting c-Cbl and Cbl-b were used, with comparable results. In panel B and C, results obtained with UTR1 (for both c-Cbl and Cbl-b) are shown (see Materials and methods for details). (D) Top, HeLa cells were treated with EGF as indicated for 2 min and then IP and IB as shown. Bottom, quantitative assessment. Results are expressed as a percentage of the maximal amount (% of max, see Materials and methods) of EGFR that coimmunoprecipitates (Co-IP) with c-Cbl (from now on Cbl), Grb2 or Shc.
Source data for this figure is available on the online supplementary information page.

