Figure 5.
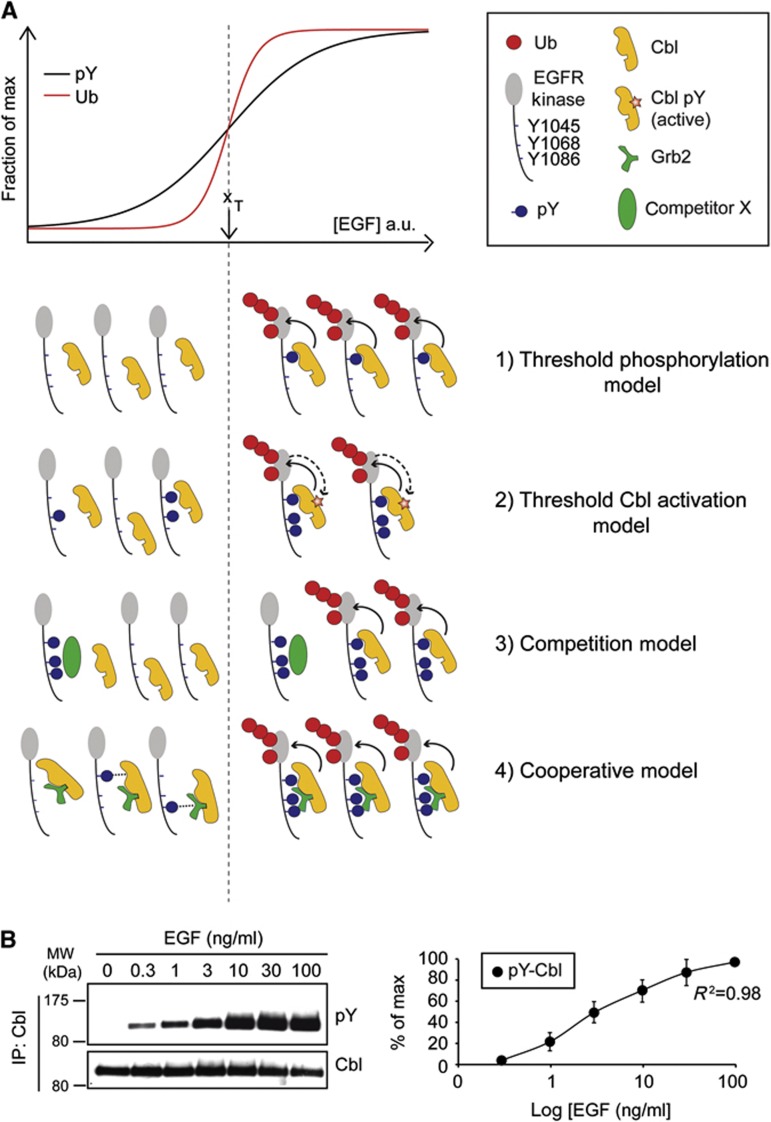
Models describing the generation of EGFR-Ub threshold. (A) Top, schematic representation of EGFR ubiquitination and EGFR phosphorylation, as a function of ligand concentration. xT represents the half-maximal EGF dose for EGFR ubiquitination (i.e., the ubiquitination threshold) and it is used to separate in the pictograms underneath (dashed line) the events occurring at low EGF (left) from those occurring at high EGF (right). In the inset, the various symbols used in the models are shown. Various models potentially accounting for the EGFR ubiquitination threshold (in all models the ubiquitination of EGFR by Cbl is indicated by a solid arrow line). 1) Threshold phosphorylation model. The model contemplates that the phosphorylation of individual Cbl-binding sites on EGFR (pY1045 or one between Y1068 and Y1086) increases in a sigmoidal fashion with the doses of EGF. The model is depicted for pY1045, but it could be equally applied to the indirect (Grb2-mediated) binding site(s) (pY1068/pY1086). 2) Threshold Cbl activation model. The model contemplates that the enzymatic function of Cbl is activated in a nonlinear fashion by signalling events (e.g., direct tyrosine phosphorylation of Cbl by the EGFR, indicated by a dashed arrow line) that occur only under high EGF. 3) Competition model. This model invokes the existence of a high affinity, rate-limiting (low amount) competitor X. At low EGF (left), such competitor—that in the model would bind only to activated EGFR—prevents Cbl from interacting with the EGFR or from ubiquitinating the receptor (in this latter case, either directly inhibiting Cbl activity or masking Ub sites on the EGFR, not shown). At high EGF (right), the competitor becomes limiting and Cbl could therefore bind and ubiquitinate the EGFR. 4) Cooperative model. Cbl/Grb2 complex binds stably to EGFR only when pY1045 and at least one of pY1068 and pY1086 are present in the same EGFR molecule. In this case, the EGFR phosphorylation pattern determines the ubiquitination threshold. At low EGF (left), EGFR is poorly phosphorylated and the probability of having the two key sites in the same EGFR molecule is low (possible low-affinity binding of the Cbl:Grb2 complex to single sites is shown by a dotted line). However, this probability increases at high EGF (right) allowing for the cooperative recruitment of Cbl/Grb2. This model implies that phosphorylation sites are phosphorylated independently of one another (as shown experimentally in Figure 7C and Supplementary Figure 7) and therefore the probability of having one site phosphorylated within the same EGFR molecule increases gradually with the EGF concentration, while the probability of having two sites increases sharply. (B) EGF dose–response curve of Cbl phosphorylation. Left, HeLa cells were treated with EGF for 2 min as indicated. Lysates were prepared in RIPA buffer (w/ 1% SDS) and then diluted to 0.2% SDS (see Materials and methods). IP and IB was as shown. Right, quantitation of the blots.
Source data for this figure is available on the online supplementary information page.

